Task Studio
Task Studio is one of the wizards included in the NSIS Cloud product, available to logged-in users. The application is used for automating and visually modeling geoprocessing workflows.
With Task Studio, the user can:
create Processes (models),
combine different tools and data within a single workflow,
design processes without the need for programming,
1. Application launch
To launch the Task Studio application, a user logged into NSIS Cloud clicks the “Add resource” button, selects Analysis from the menu, and then chooses New process from the submenu.
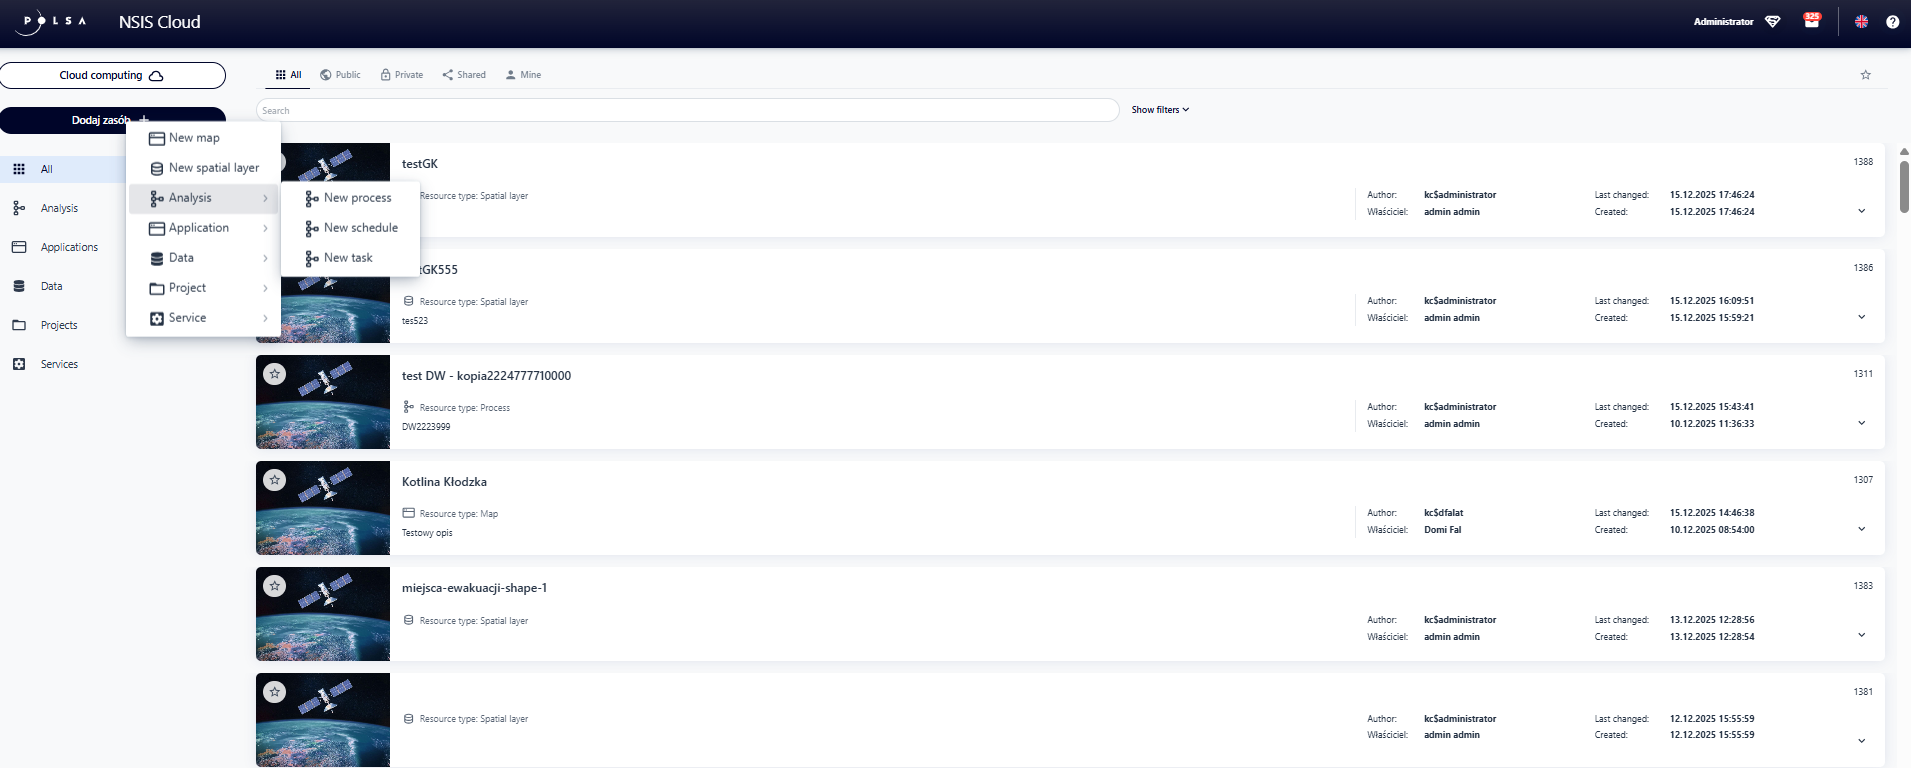
Fig. 1. Launching the Task Studio application
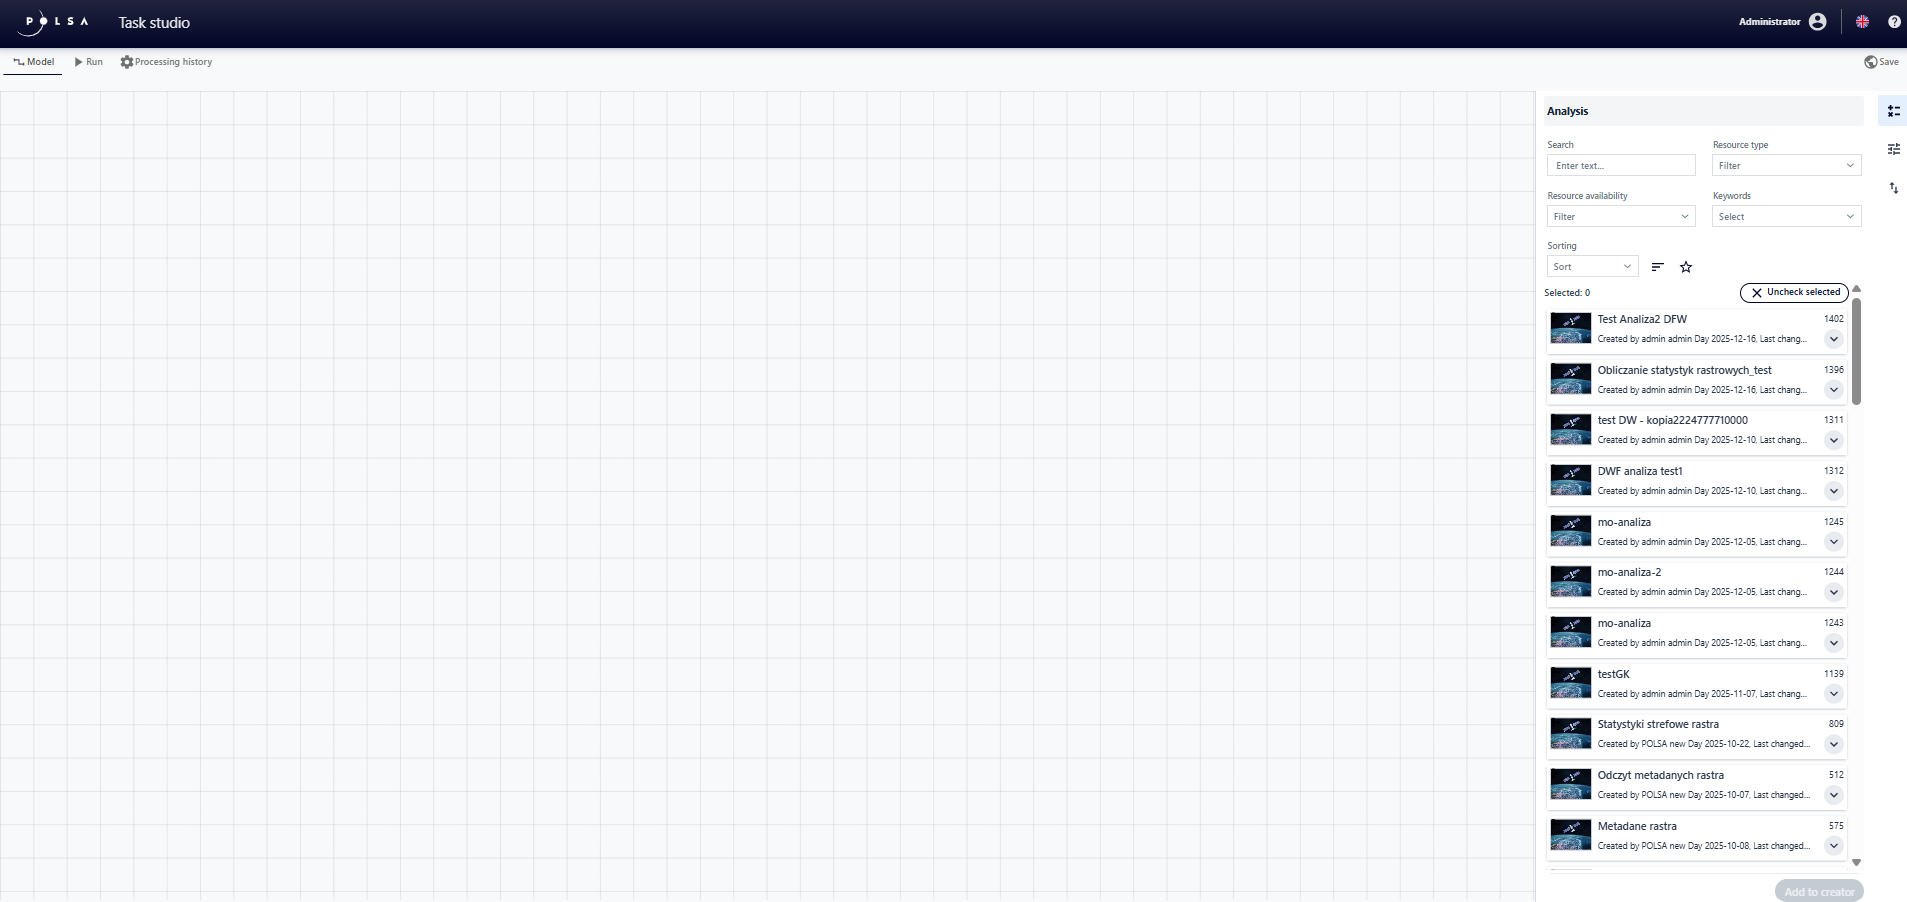
Fig. 2. Task Studio application
2. Description of user interface controls
Element |
Description |
|---|---|

|
“Model” tab |

|
“Run” tab |

|
“Processing history” tab |

|
|

|
|

|
“Import/Export” button in the vertical menu, under the “Model” tab |

|
Analysis “Search” field in the “Analyses” panel , under the “Model” tab |
|
|
|
“Resource availability” filter in the “Analyses “ panel, under the “Model” tab |
|
|
|
|

|
“Change sorting direction” button in the “Analyses” panel, under the “Model” tab |

|
|

|
“Deselect Selected” button in the “Analyses” panel, under the “Model” tab |

|
“Add to Wizard” button is located in the “Analyses” panel, under the “Model” tab |
|
“Task” block in the wizard |

|
“Input Parameter” tile is located in “Parameters” panel, in the “Model” tab |

|
“Input parameter” block in the wizard |
|
“Constant” tile in the “Parameters” panel, under the “Model” tab |
|
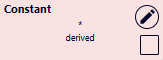
“Constant” block in the wizard |
|
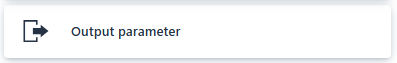
“Output Parameter” tile in “Parameters” panel, under the “Model” tab |
|
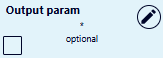
“Output parameter” block in the wizard |

|
Button that activates the block configuration from the wizard level |

|
On/Off switch in block configuration |

|
“Add all required parameters” button in the configuration of the “Task” block |

|
“Name”/”Alias”/”Description”/”Default value” in put fields in the parameter block configuration |

|
“Select resource” tab in the input parameter configuration |

|
The “Enter value” tab in the input parameter configuration |

|
“Select resource” button in the input parameter |

|
|

|
|

|
“Save” button in parameter block configuration |

|
|

|
|

|
“Save” button |

|
|
|
|
|
|
|
|

|
“More Resource Information” button in the “Resource Information” panel |

|
|

|
|

|
“Run” button in the “Run” panel |

|
|
Table 1. Description of user interface controls
3. Creating a Model
The user creates a Process by visually connecting elements such as:
Input parameters,
Constants,
Tasks and/or other Processes
Output parameters.
This process takes the form of a block diagram, which allows a visual representation of the relationships between components. While creating the model, the user defines the sequence of operations and the dependencies between individual blocks, thereby constructing an automated workflow.
The created model can be saved and reused with different datasets, enabling fast and efficient execution of subsequent analyses.
Adding an Analysis
In the “Model” tab, within the “Analyses” panel, the user searches for the selected “Task”/”Process” by entering the name of the “Task” or the resource ID in the “Search” field.
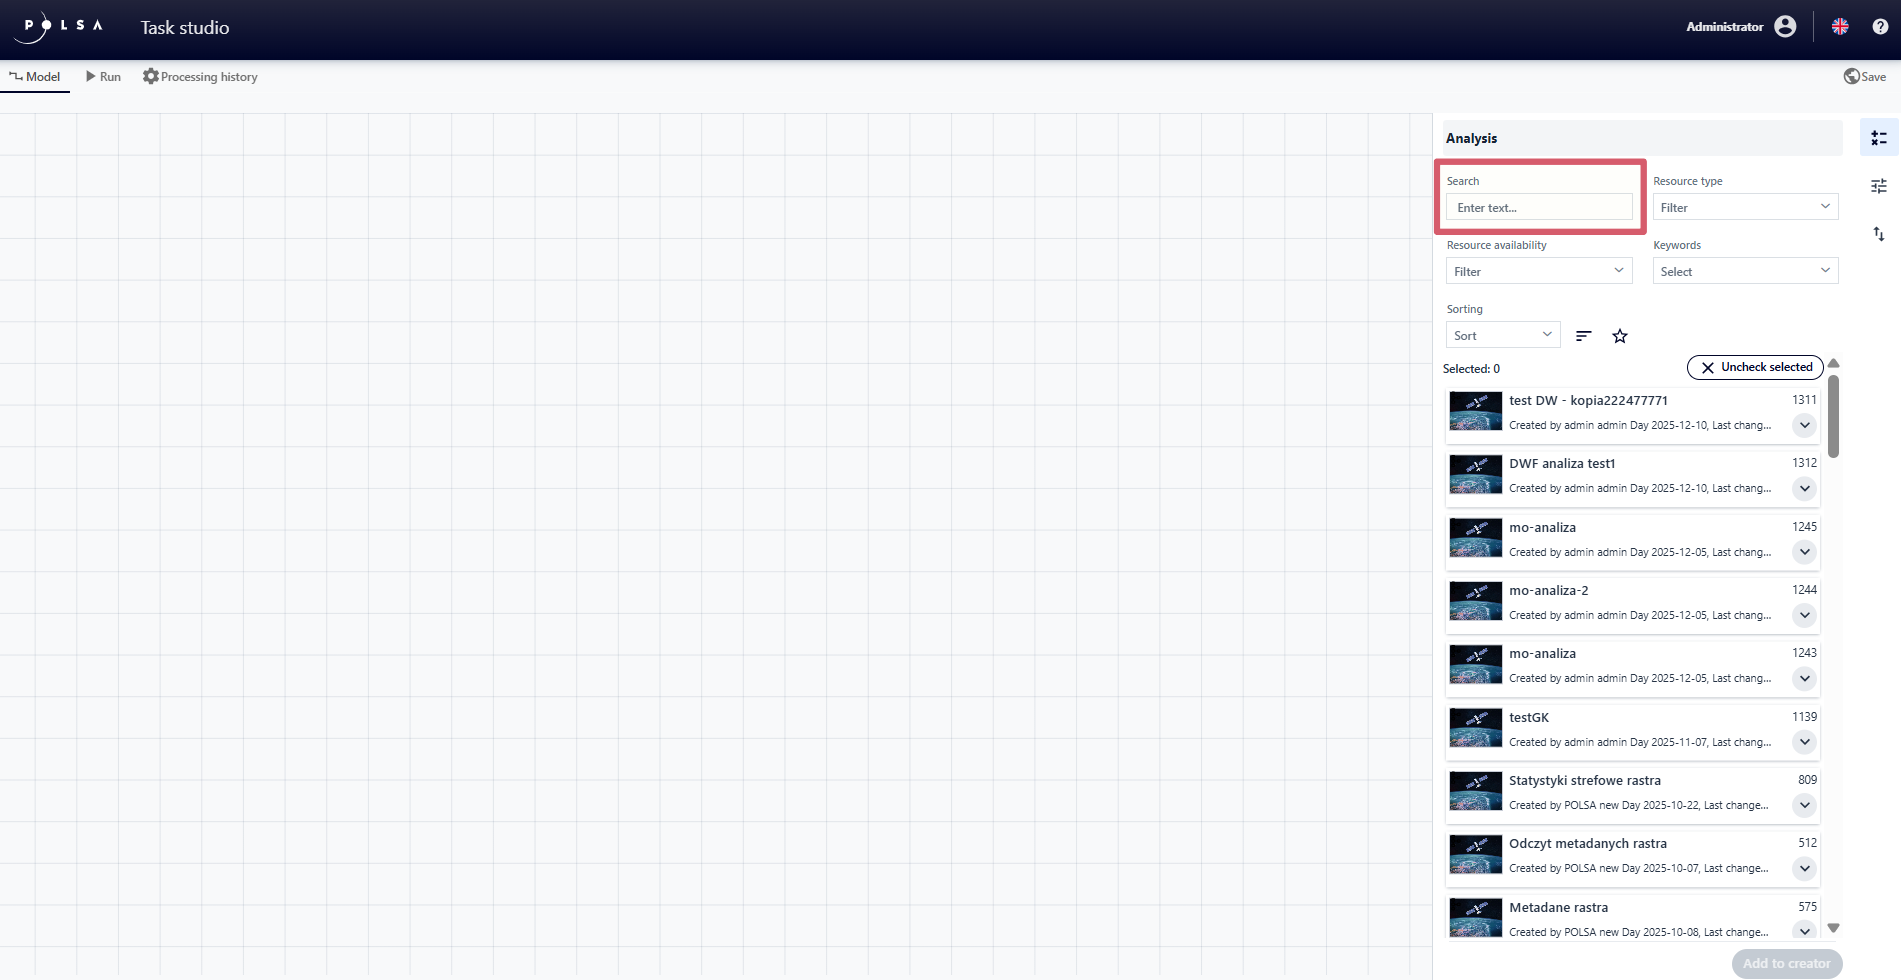
Fig. 3. Searching Analysis
The “Task” resource is created in the NSIS Cloud application.
Only a user with the NSIS Cloud Administrator role has permission to create it.
The application also allows filtering and sorting the resource list, making it easier to quickly find the elements needed for the model being built. The available filtering options include:
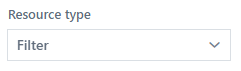
Resource type - limits the list to “Task” or “Process”.
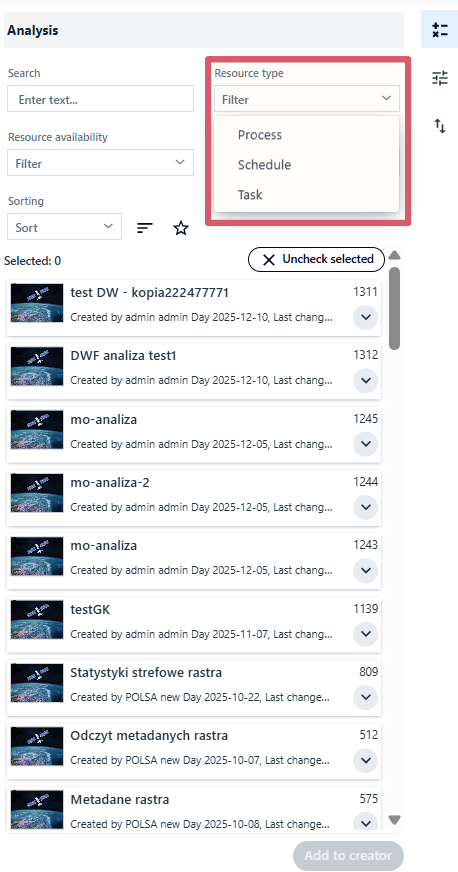
Fig. 4. Resource type filter
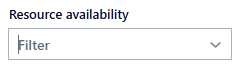
Resource availability - displays resources according to one the following categories:
Public (resources available to all logged-in users),
Mine (resources created or owned by the logged-in user),
Shared (resources to which the user has been granted access by other users).
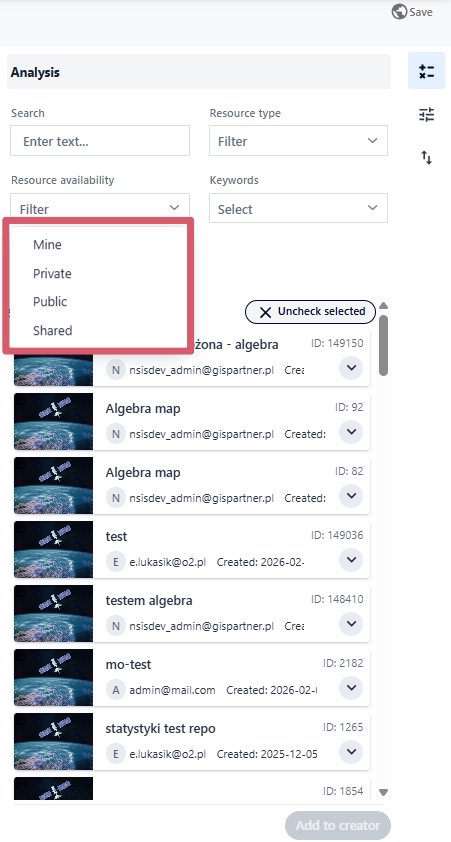
Fig. 5. Resource availability filter
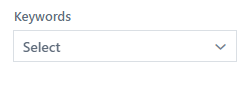
Keywords - filters the resource list by words assigned to them.
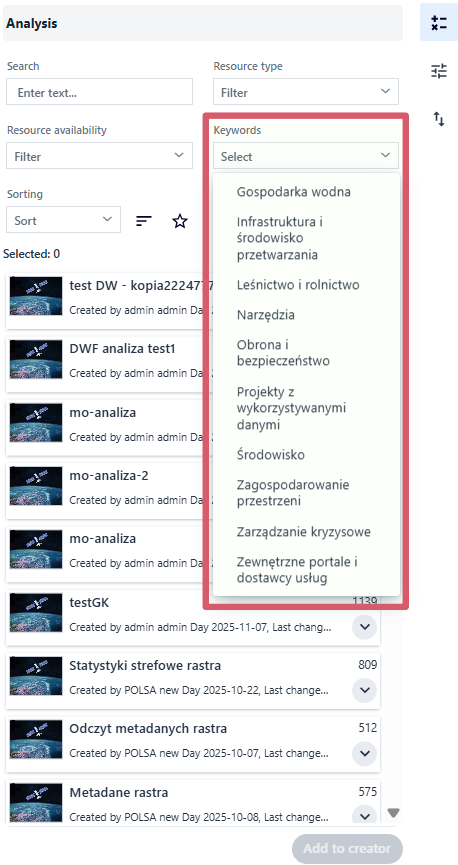
Fig. 6. Keywords filter
Favorite - presenting only resources marked by the user as favorites.
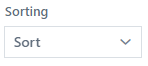
Filtering can be combined with the sorting function to further organize the results. The user selects a criterion from the drop-down list:
Creation Date - ordering by the date the resource was added to the system (oldest or newest first);
Date Modified - ordering by the most recent last changes made to the resource;
Resource identifier - sorting by resource ID;
Resource name - alphabetical sorting by resource name;
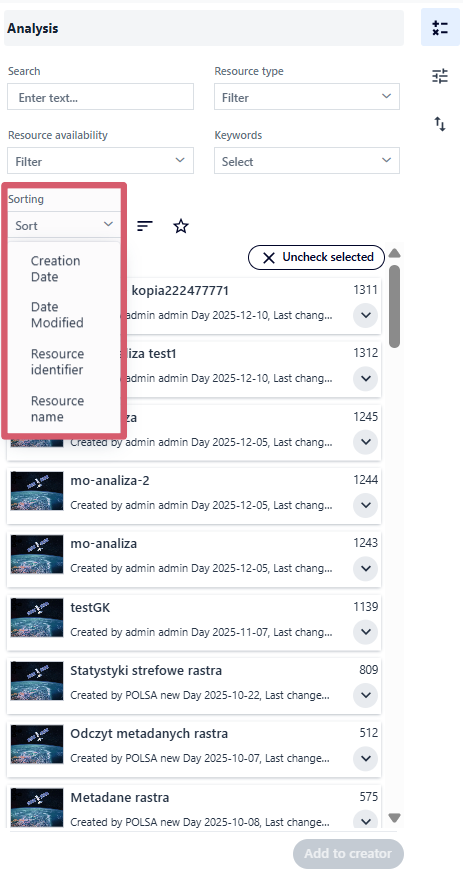
Fig. 7. Resource sorting options
Using the “Change sorting direction” button, the user can switch the order to either ascending or descending.
Example 1. Filtering the list by Resource type: Task, sorting by Name, ascending.
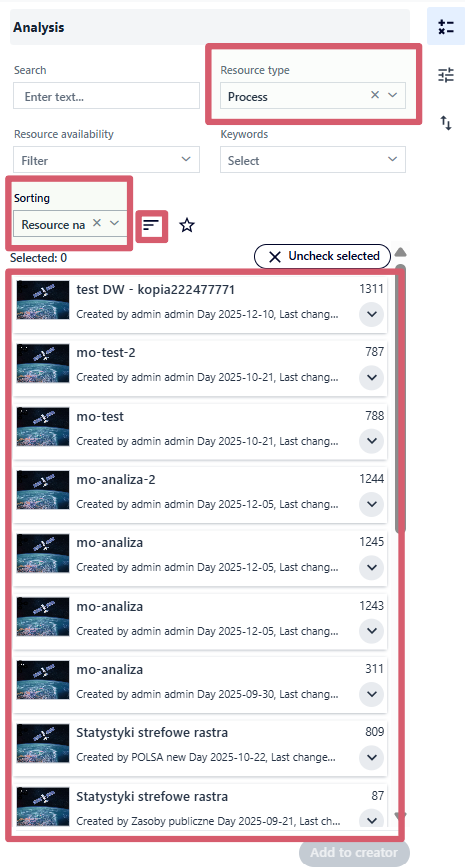
Fig. 8. Filtering and sorting the resource list
There are two ways to add a searched analysis to the wizard:
using the button - the user selects the chosen resource(s)from the list by clicking and then confirms with the “Add to wizard” button,
using the Drag&Drop method - the user drags the selected Analysis to the appropriate place in the wizard.
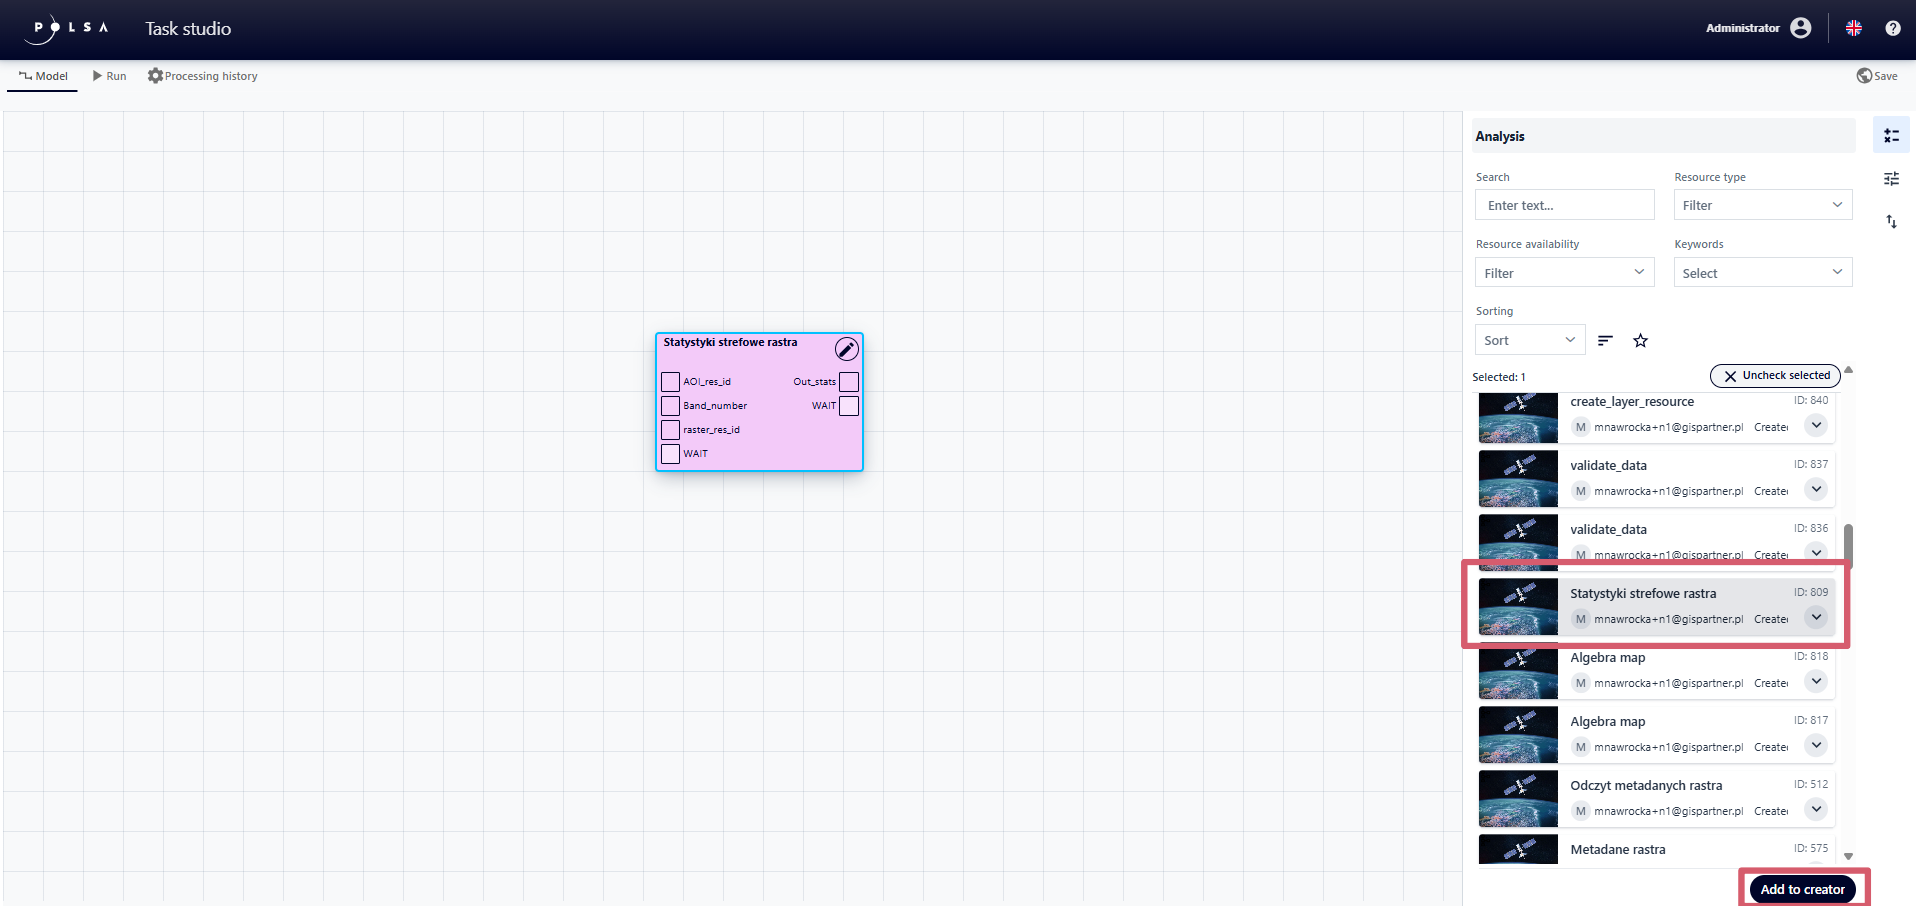
Fig. 9. Adding Elemental Analysis to the wizard
Task Configuration
Each block added to the wizard can be edited, and the available configuration options may vary depending on the type of Analysis. To configure the Analysis, the user clicks the button in the upper-right corner of the Analysis block.
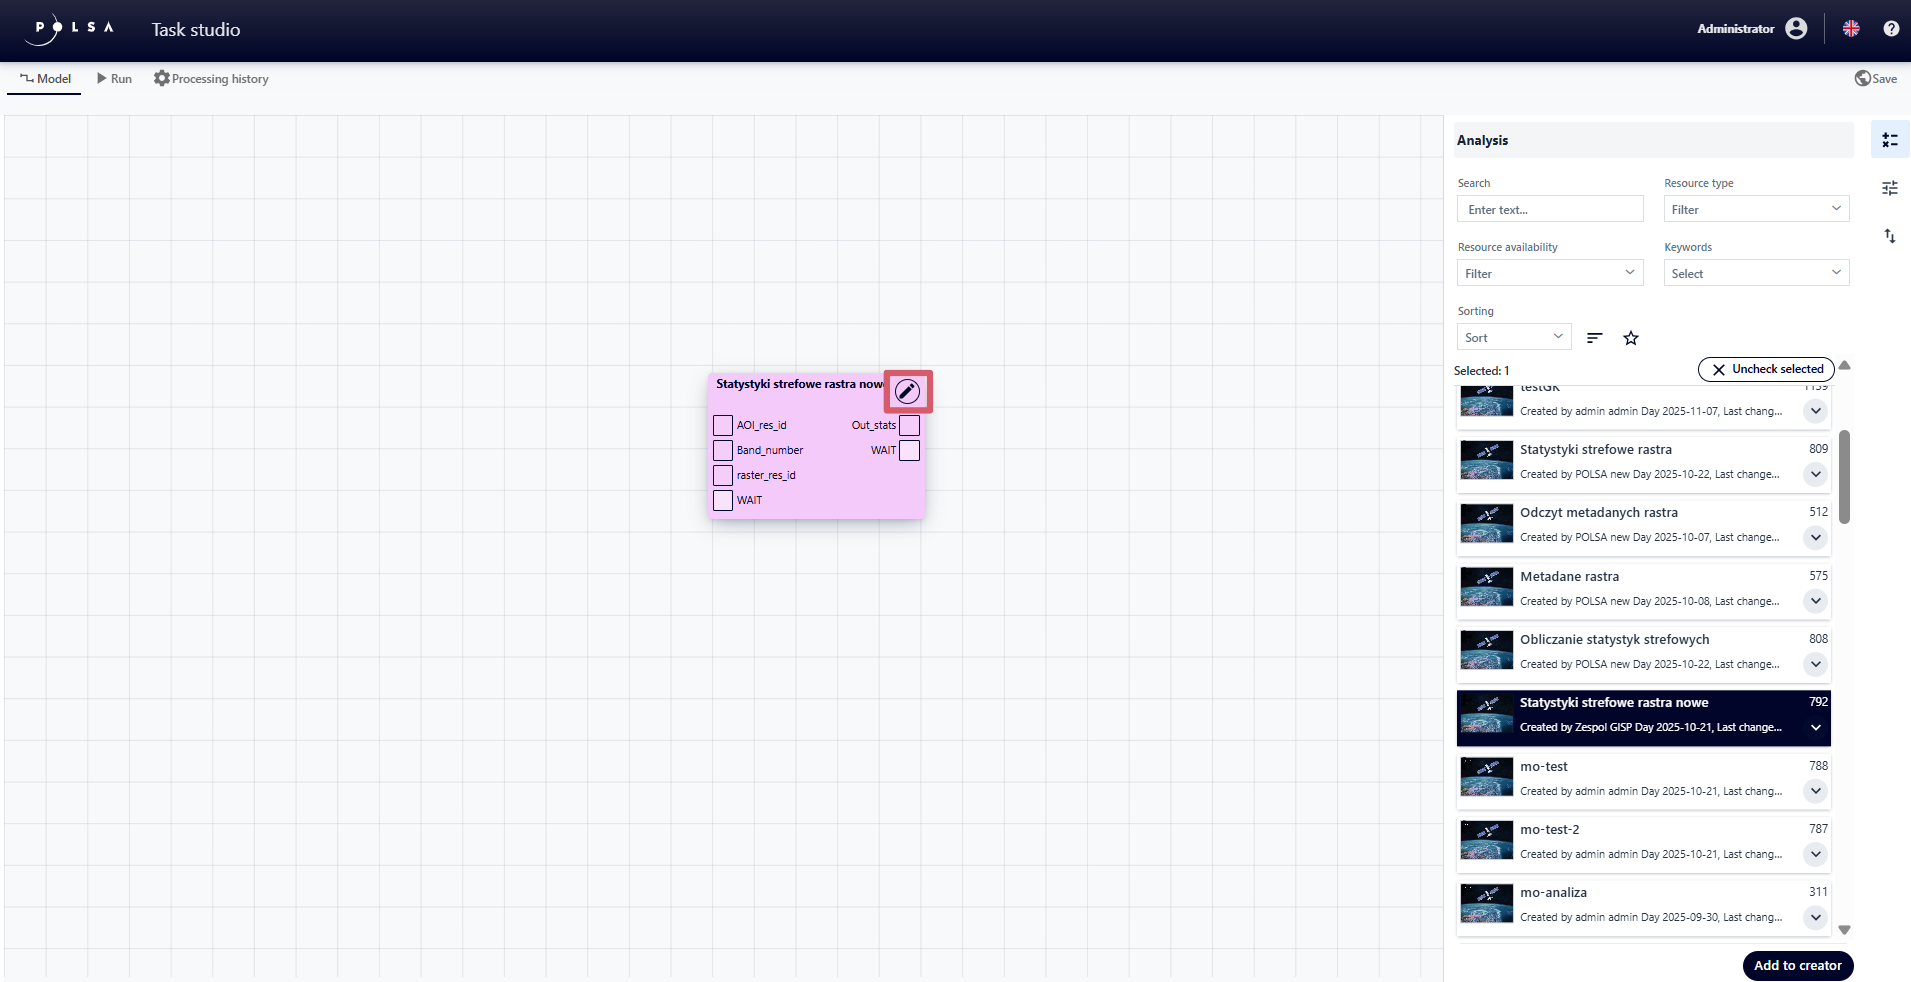
Fig. 10. Button activating the “Configuration” panel for “Task”
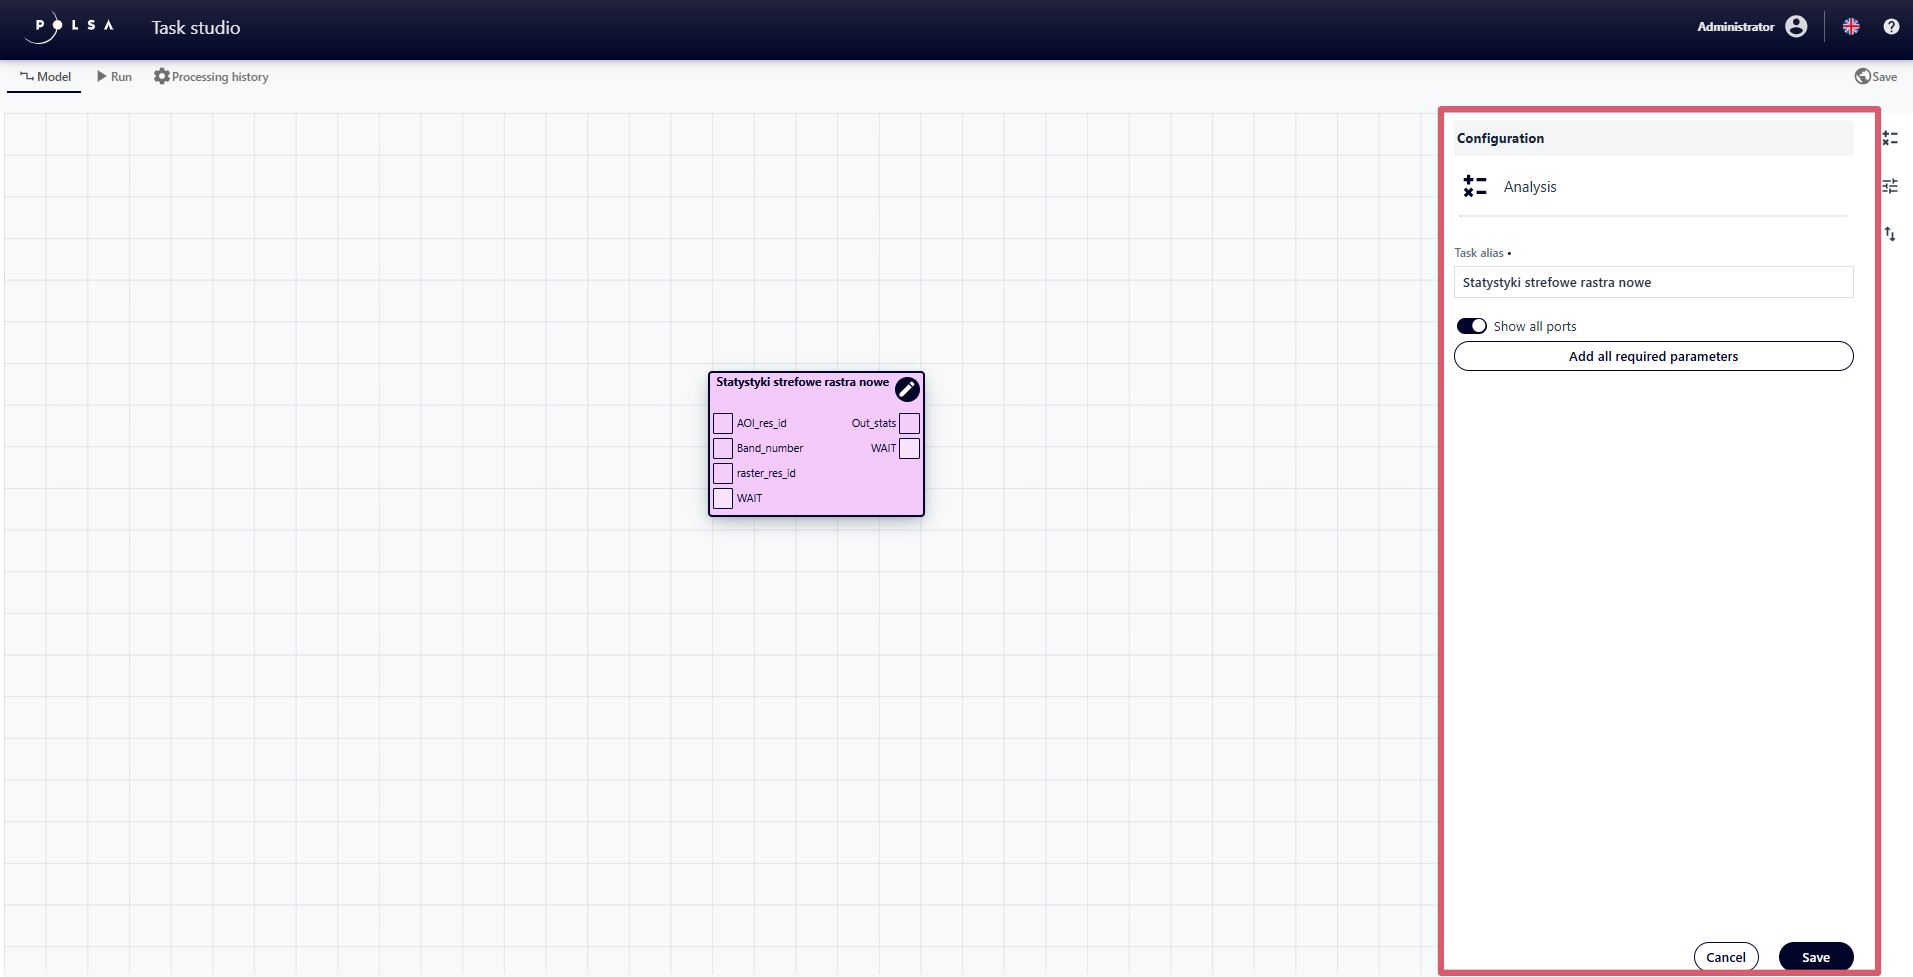
Fig. 11. “Configuration” panel for “Task”
In the “Configuration” panel for “Task” the user can:
change the Alias of the element by editing the “Task alias” field,
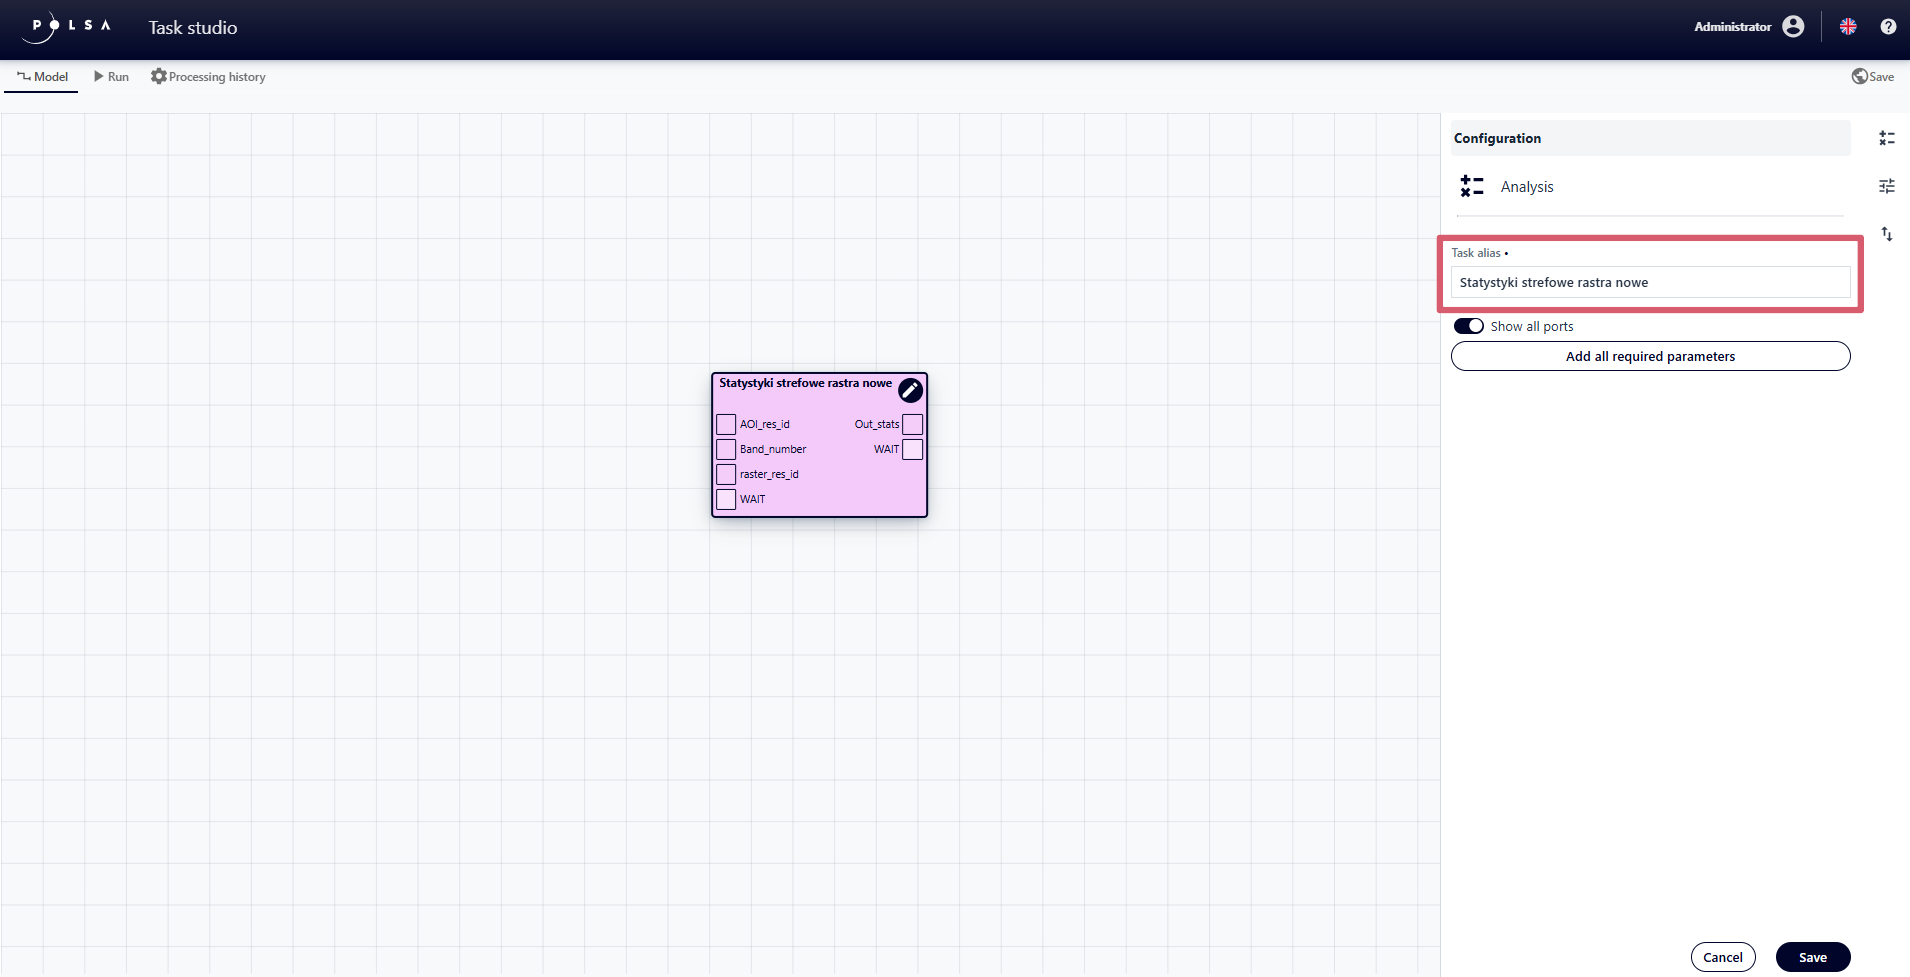
Fig. 12. Editing Task Alias
hide optional ports using the “Enable/Disable” switch
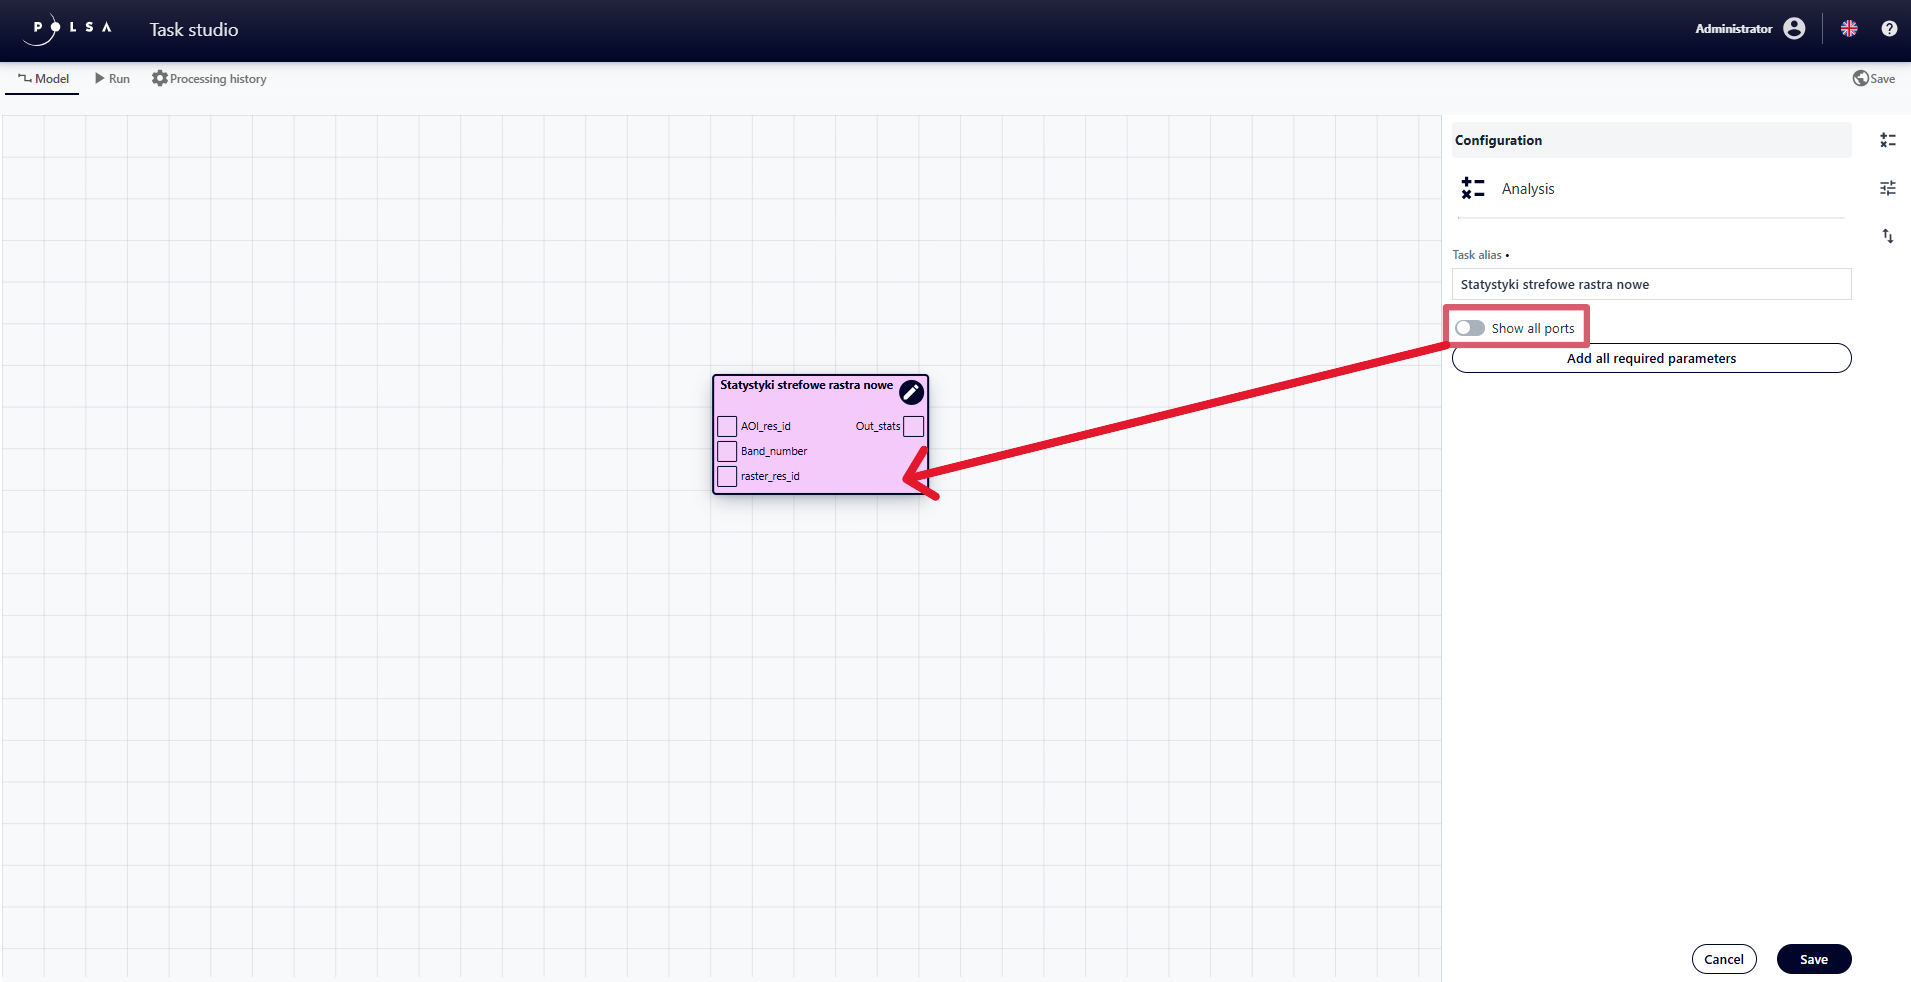
Fig. 13. Hiding ports
add all required parameters automatically, using the “Add all required parameters” button
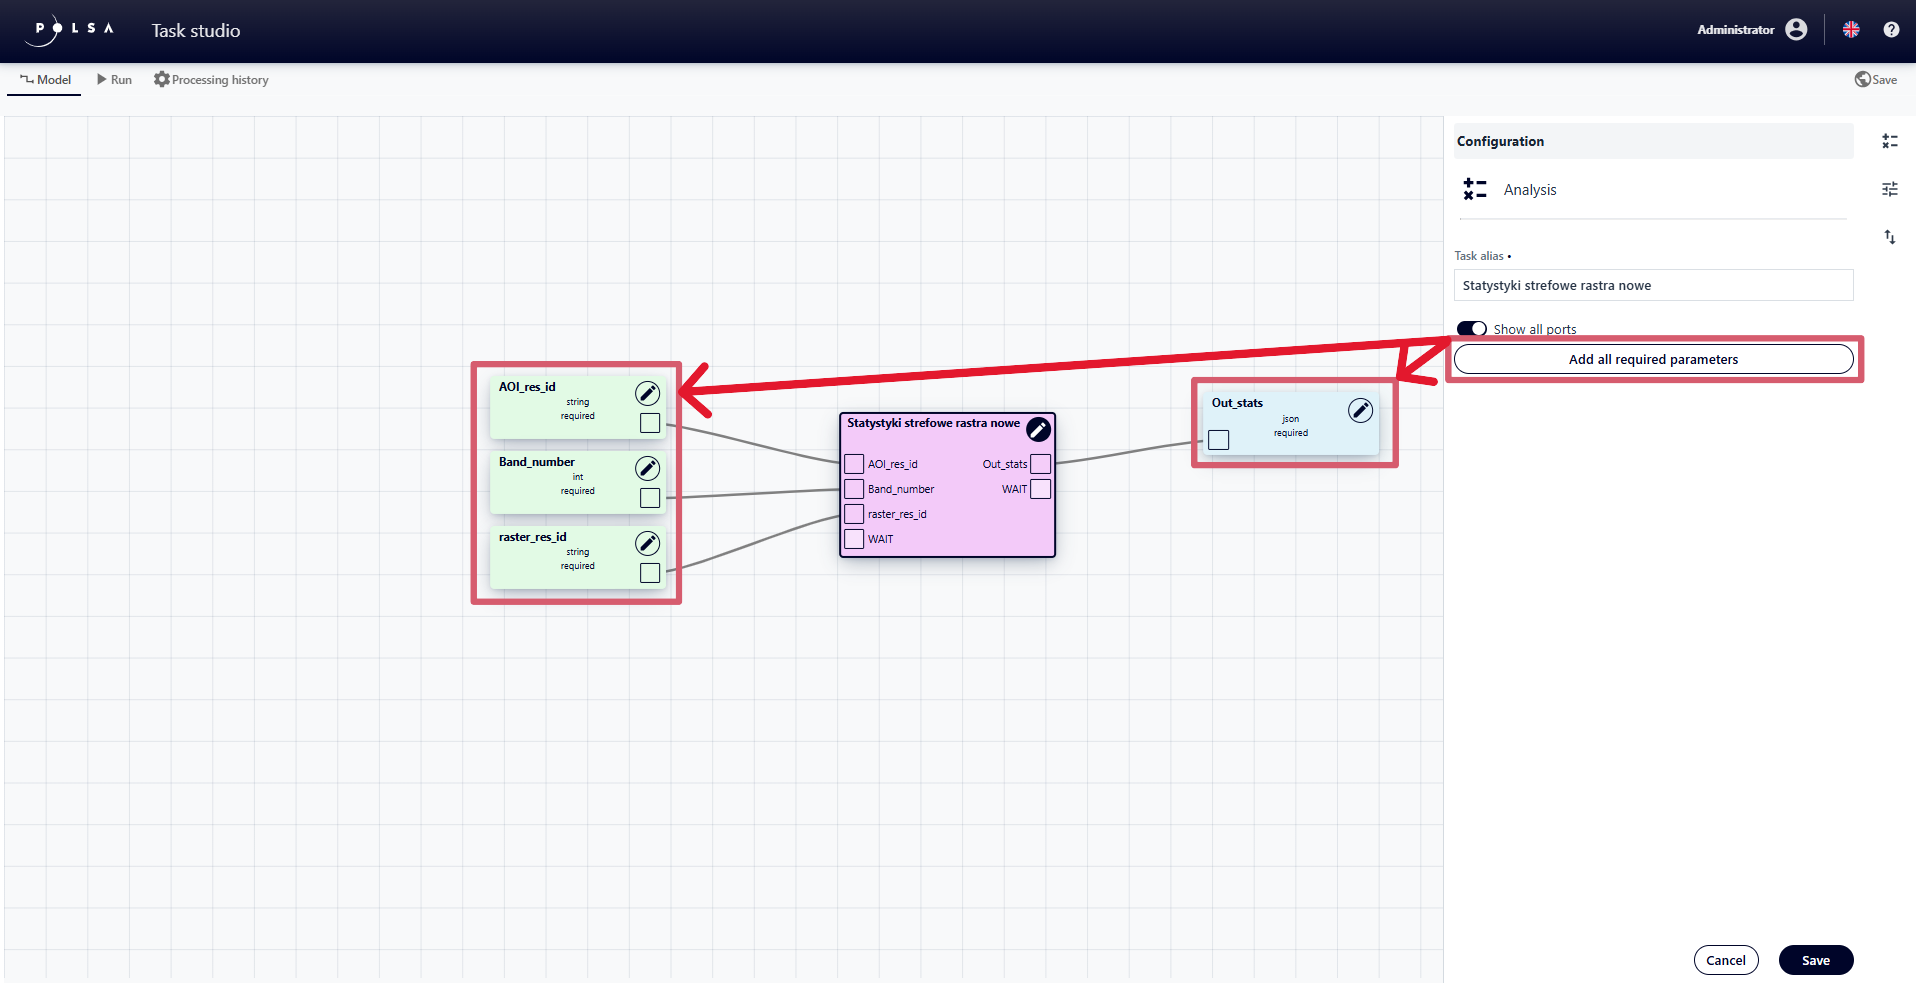
Fig. 14. Adding all required parameters
save or cancel configuration changes by clicking the “Save” or “Cancel” button
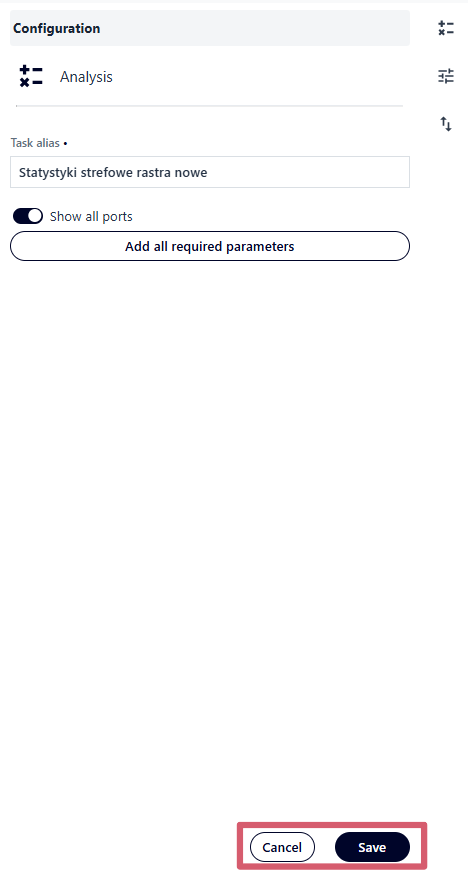
Fig. 15. Cancel/Save the “Task” block configuration
Parameters
Three types of parameters are available in the application:
Input Parameter - data or values provided by the user before running the model e.g. “Raster,” “Spatial layer,” “Algorithm,” AOI (Area of Interest).
Constant - an unchanging value e.g. buffer radius = 500 m.
Output Parameter - data generated by the model that the user receives after execution e.g. a new raster, NDVI vegetation indices.
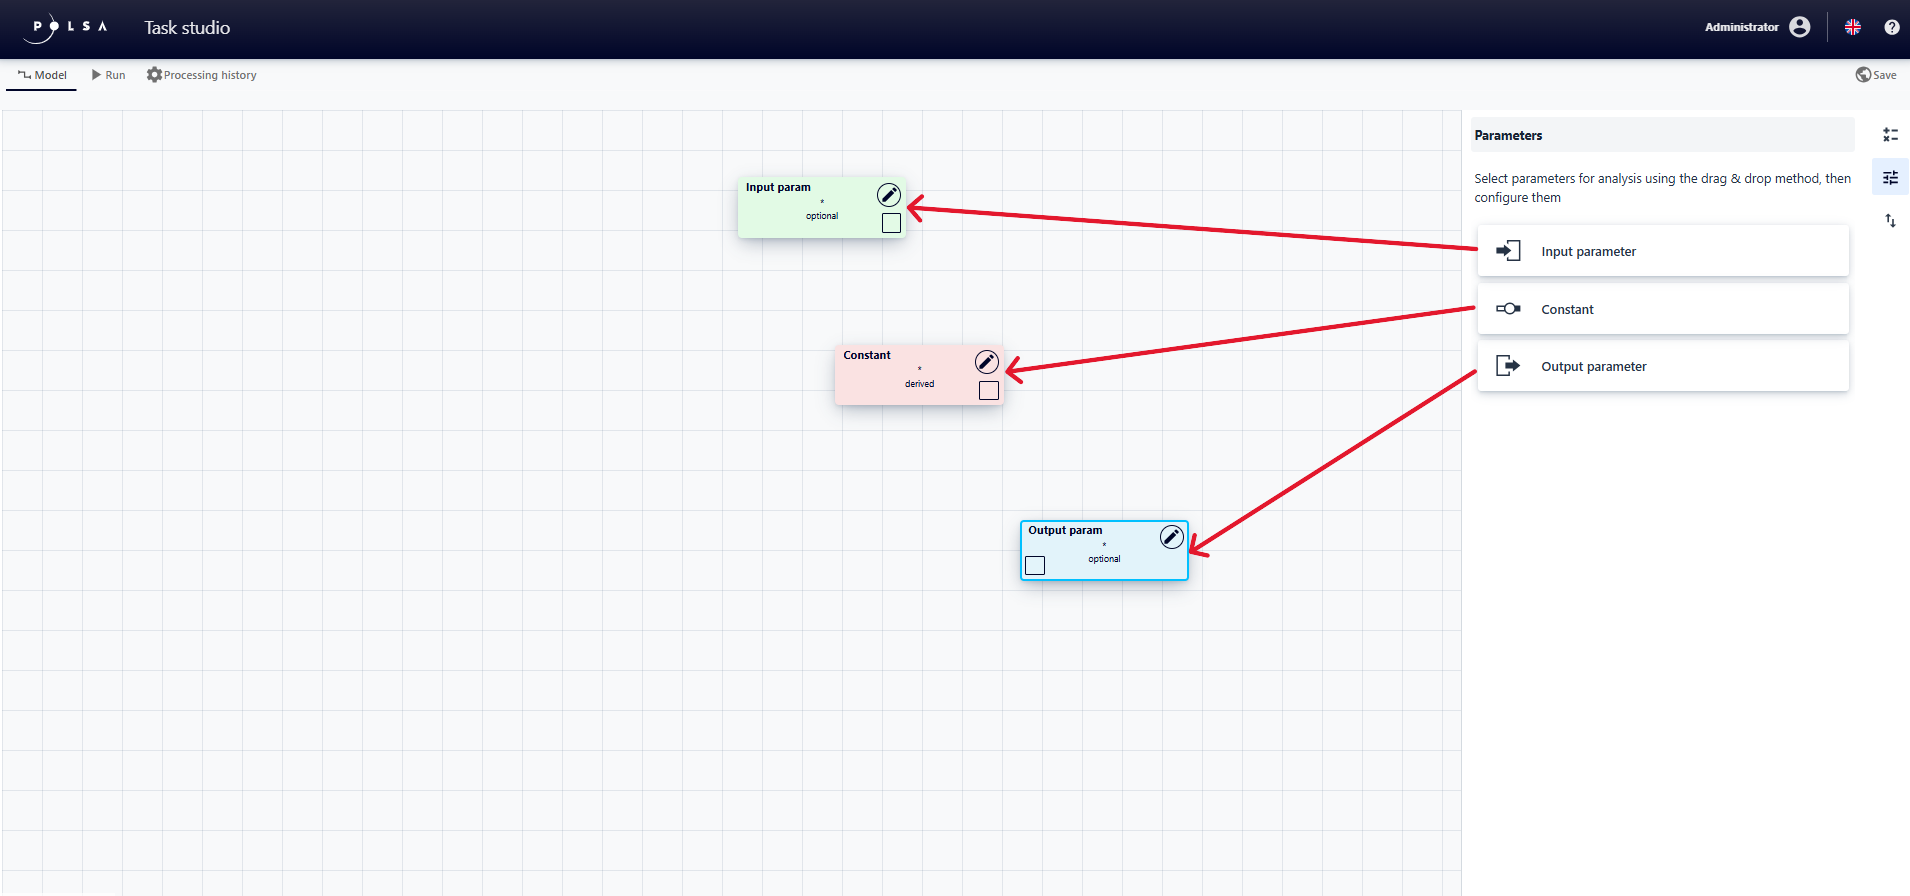
Fig. 16. “Parameters” panel and types of parameter
Adding Parameters
The user can add parameters trough:
the previously described “Add all required parameters” button in the Task Configuration,
the Parameters panel, using the Drag&Drop method** (this method requires connecting the appropriate port on the parameter block to a port on the analysis block - the user clicks on the port on the parameter block and, holding the right mouse button, drags it to the port on the analysis block)
from the “Task” block itselfs – by double-clicking the port on the analysis block.
Parameter Configuration
Similarly to “Task” to configure parameters, the user clicks the button in the upper-right corner of the parameter block.
The user can configure the following parameter elements by editing the fields:
Name,
Alias,
Description,
Type,
Value,
Default Value
For input/output parameters, the user can set whether completion is mandatory using the “Required” on/off switch.
After configuring the parameter, the user confirms the settings by clicking the “Save” button.
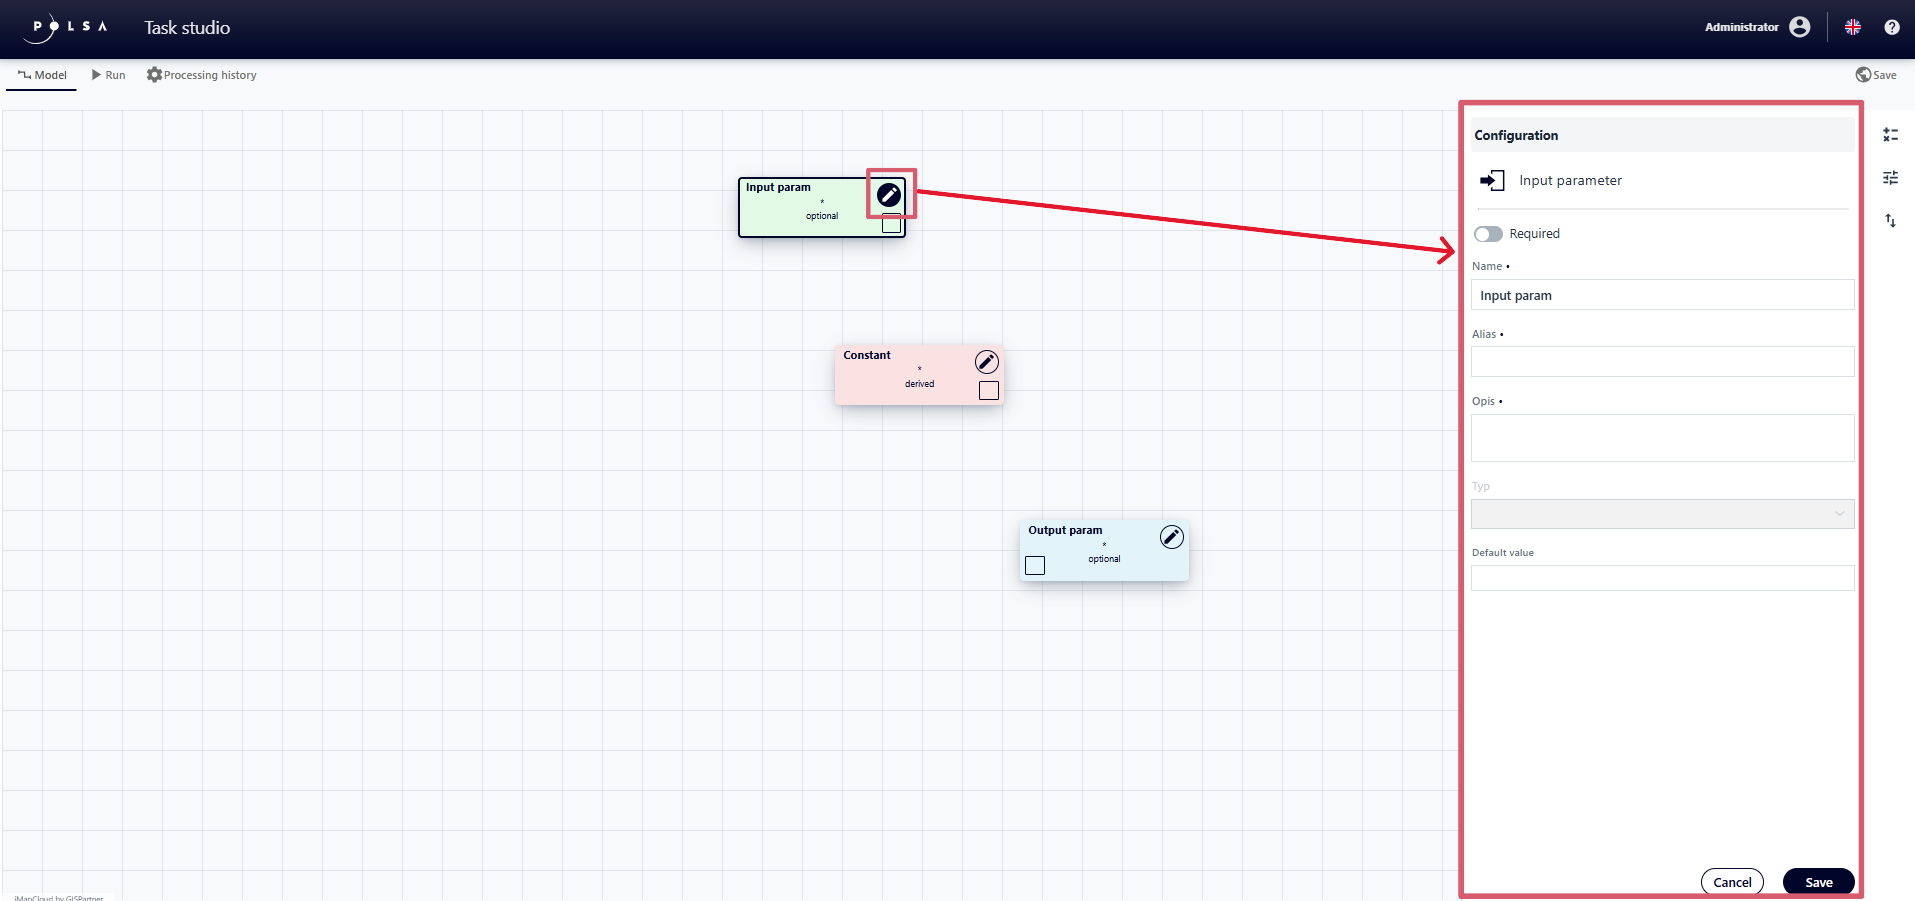
Fig. 17. Input parameter configuration
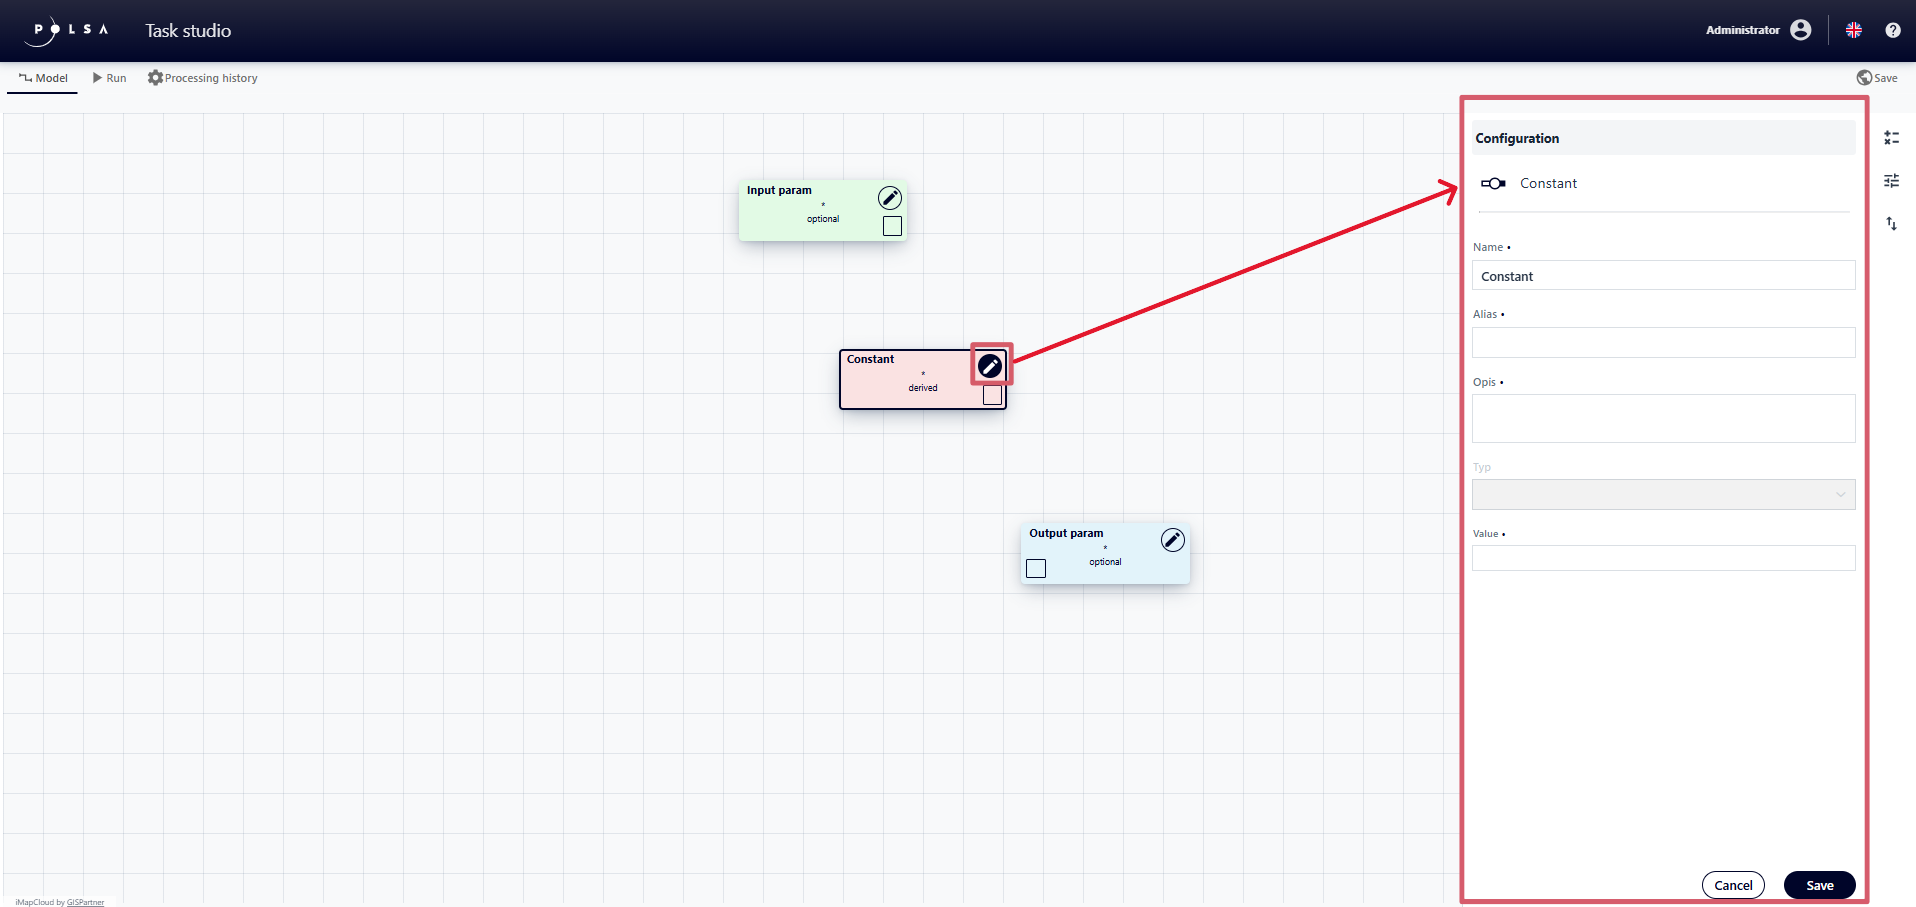
Fig. 18. Constant configuration
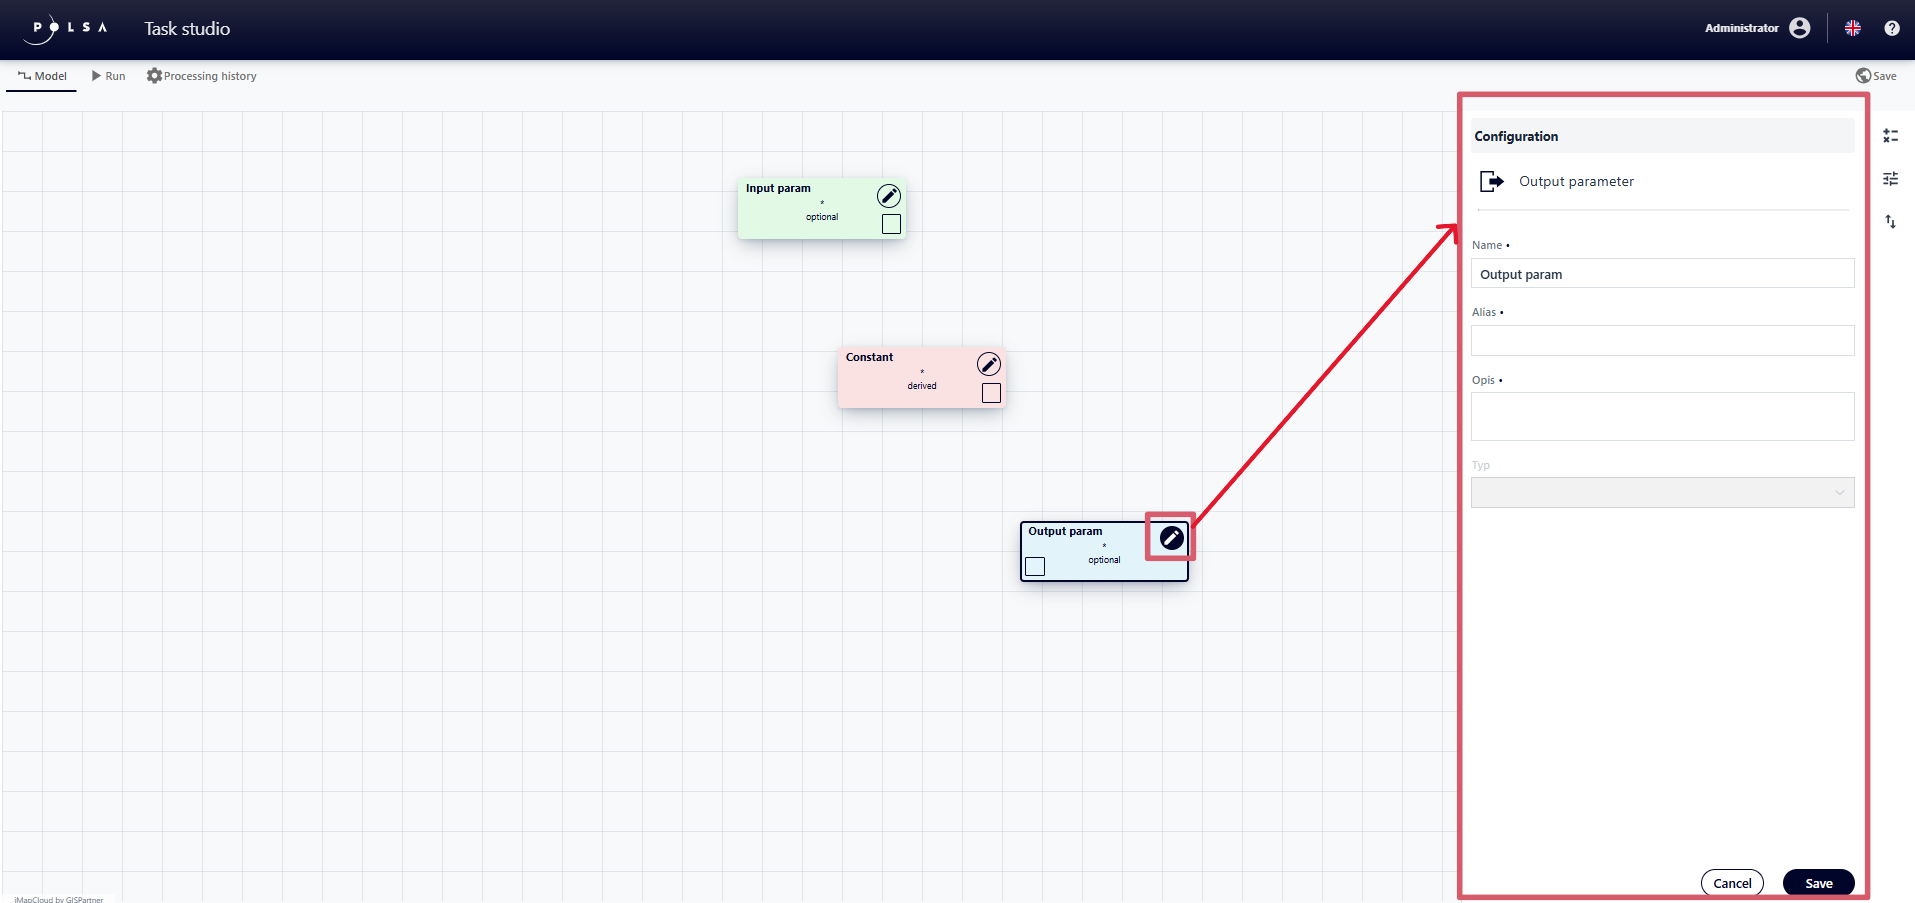
Fig. 19. Output parameter configuration
Import/Eksport
The Task Studio application allows user to import or export a model in .json format. In the Model tab, from the vertical menu, the user clicks on “Import/Export”. Then, in the “Import/Export” panel, selects the button:
“Import Model” if the user wants to load a model saved in a .json file and then configures it in the wizard;
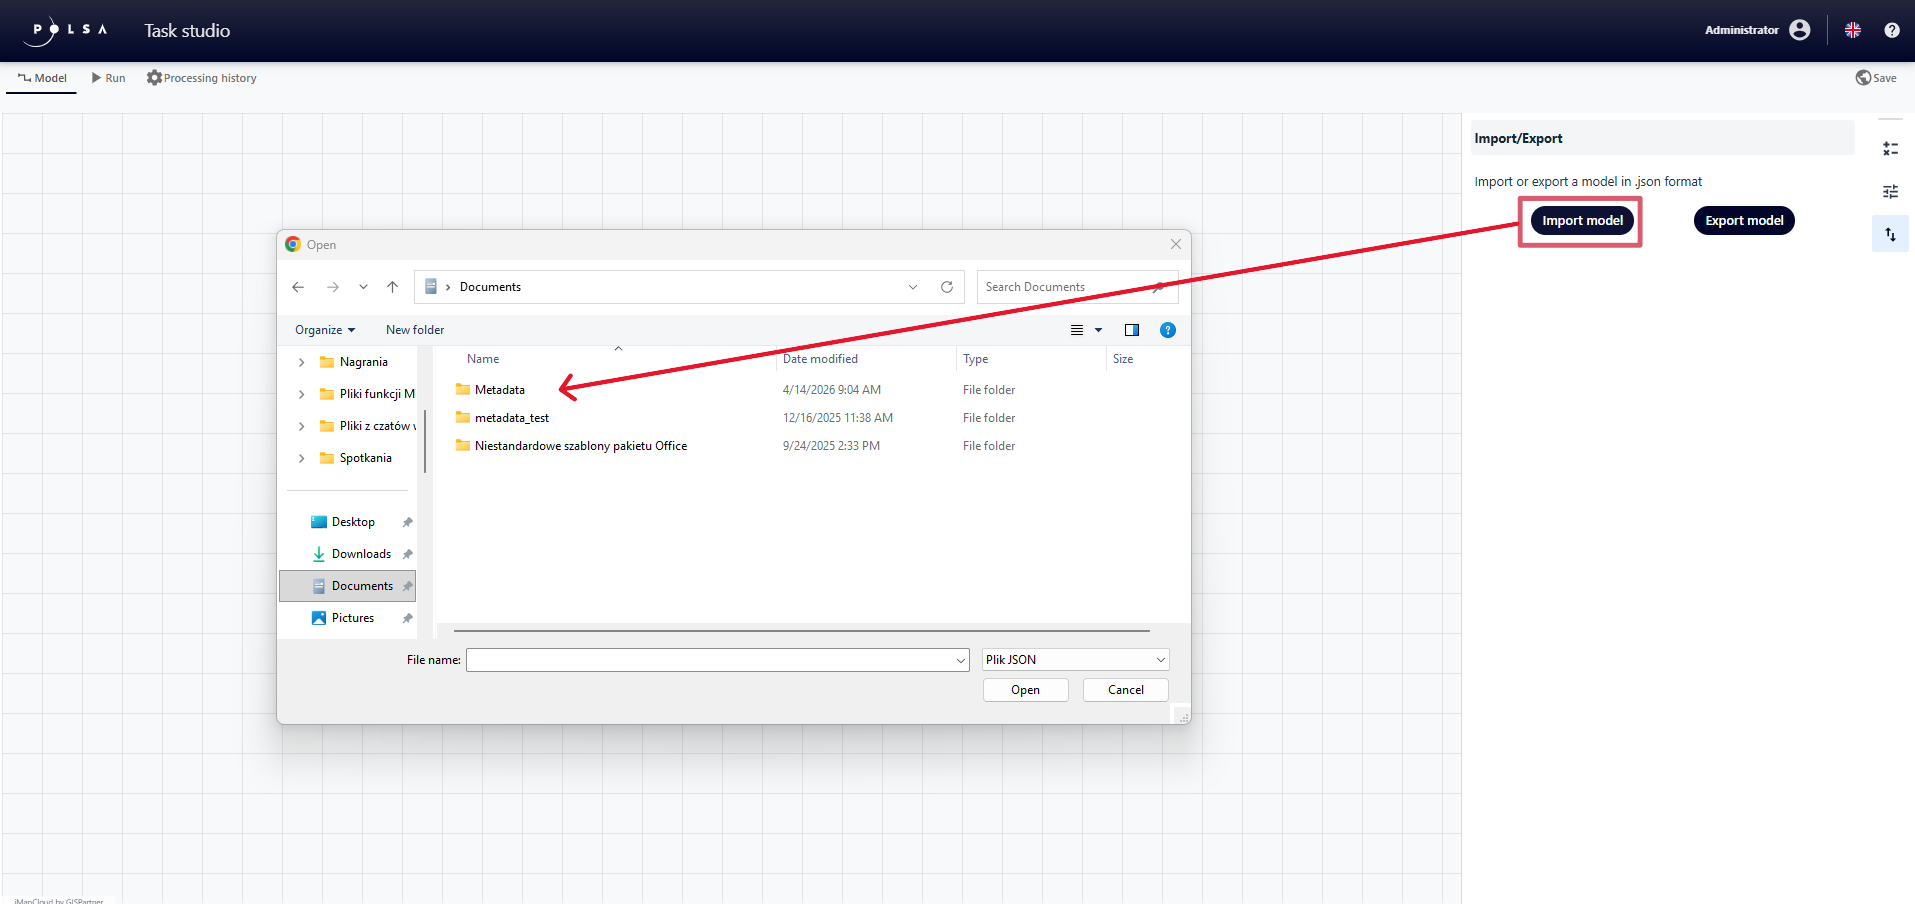
Fig. 20. Model import
“Export model” if the user wants to save the configured model to the disk as a .json file.
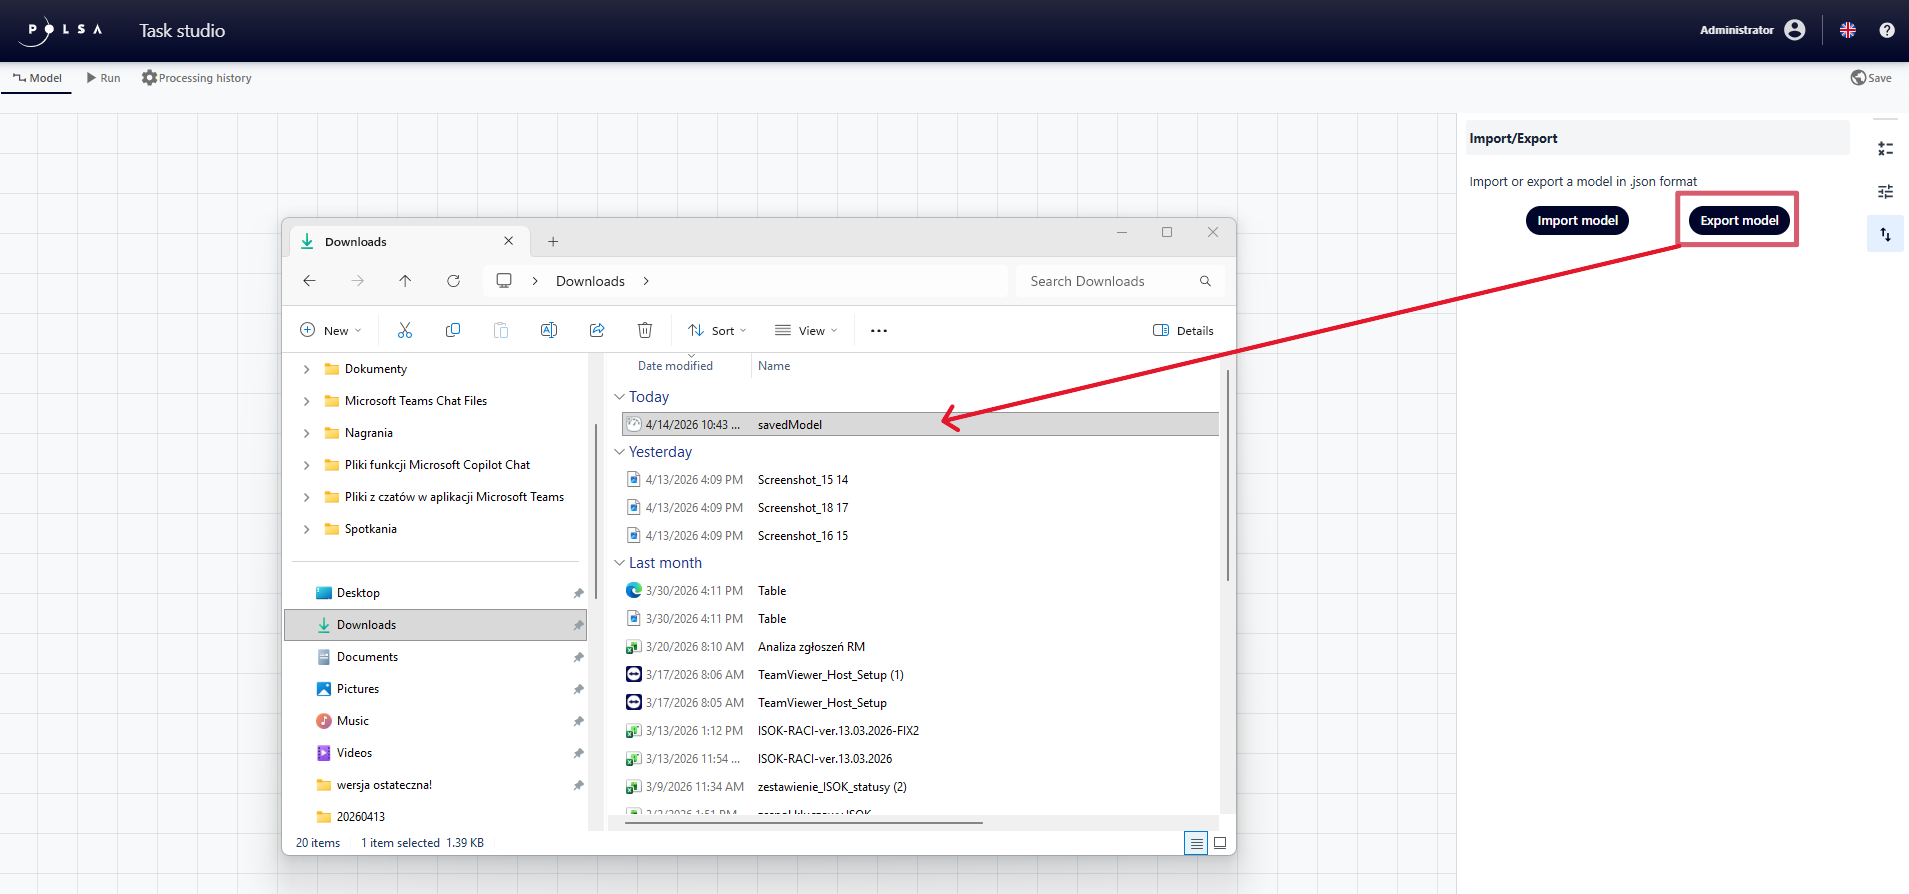
Fig. 21. Model export
4. Saving the model
Note
Before running the model for the first time, it must be saved.
To do this, the user clicks the “Save” button in the upper-right corner of the application.
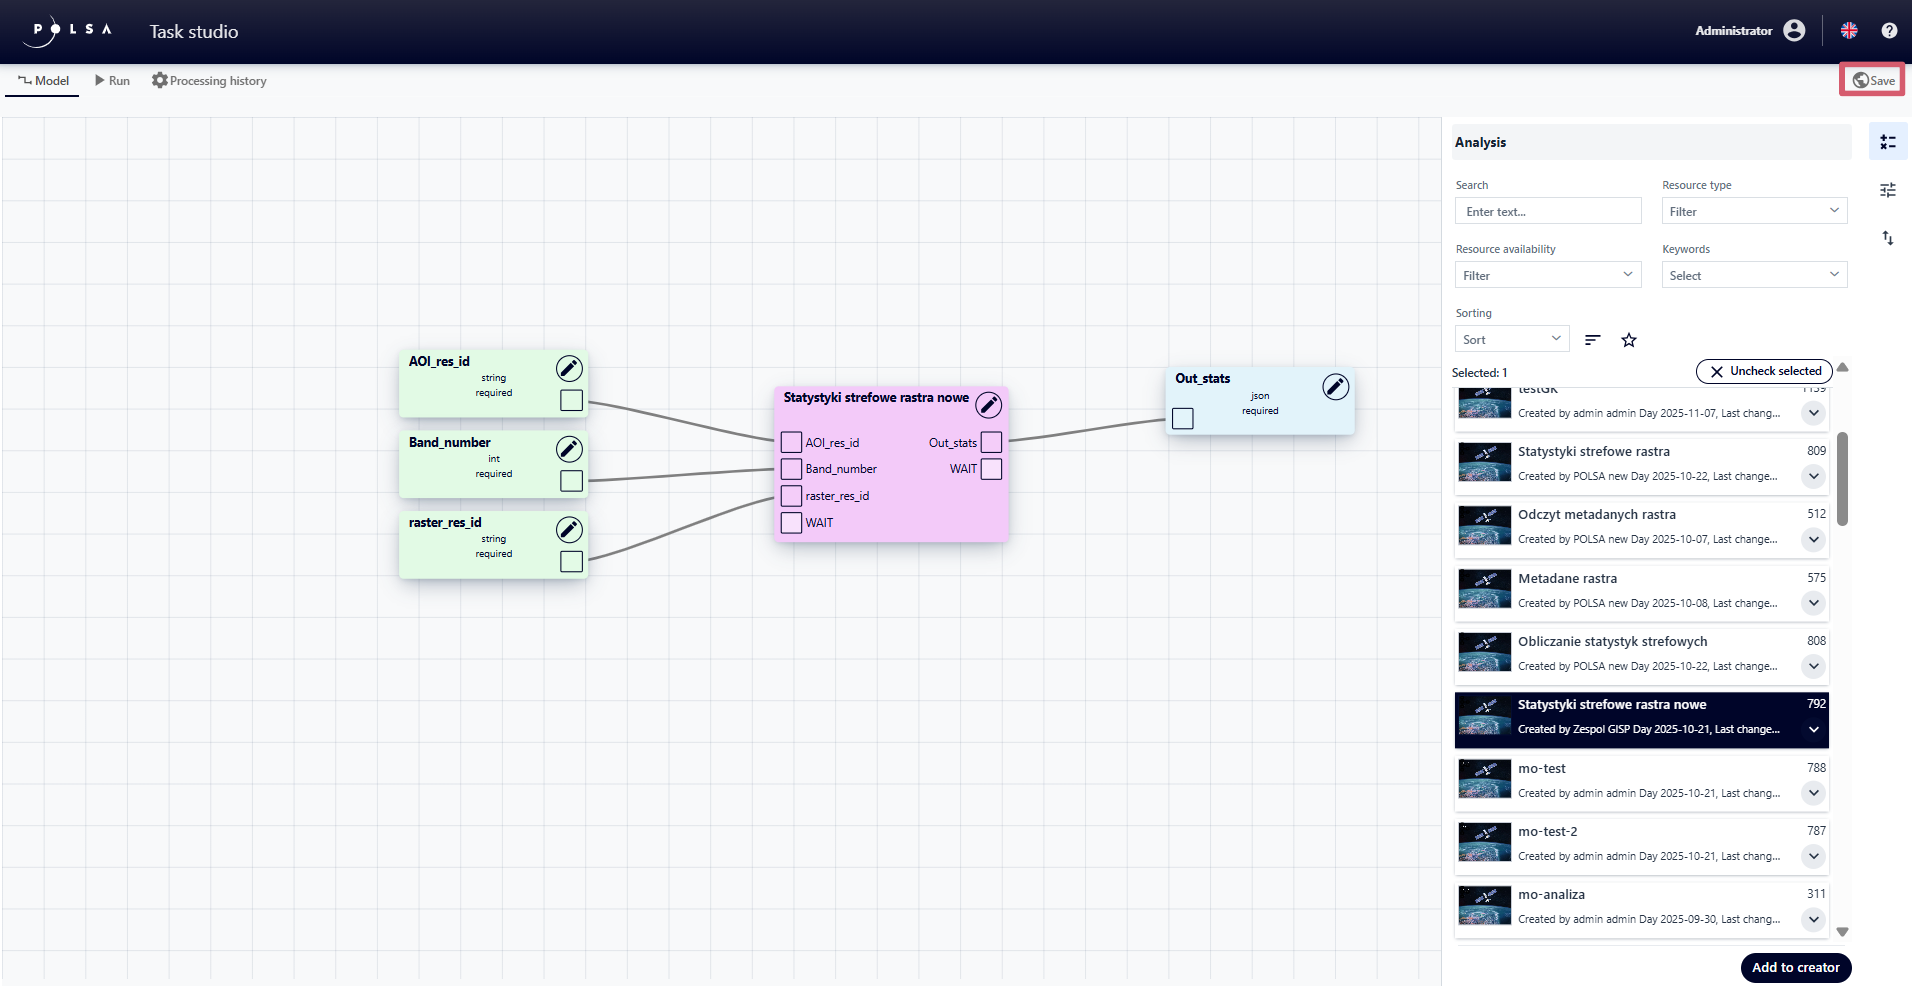
Fig. 22. “Save” button
When accessing the Run tab for the first time, the “Resource Information” panel will automatically be displayed. In this panel, the User fills in the following fields:
Resource Thumbnail - by selecting a file from local disk, the file will be displayed as a thumbnail in the resource list in NSIS Cloud.
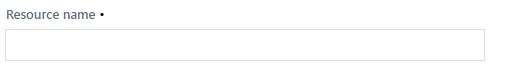
Resource name - by entering a name.
Resource description - by providing a description.
Keywords - by selecting keywords from the dropdown list.
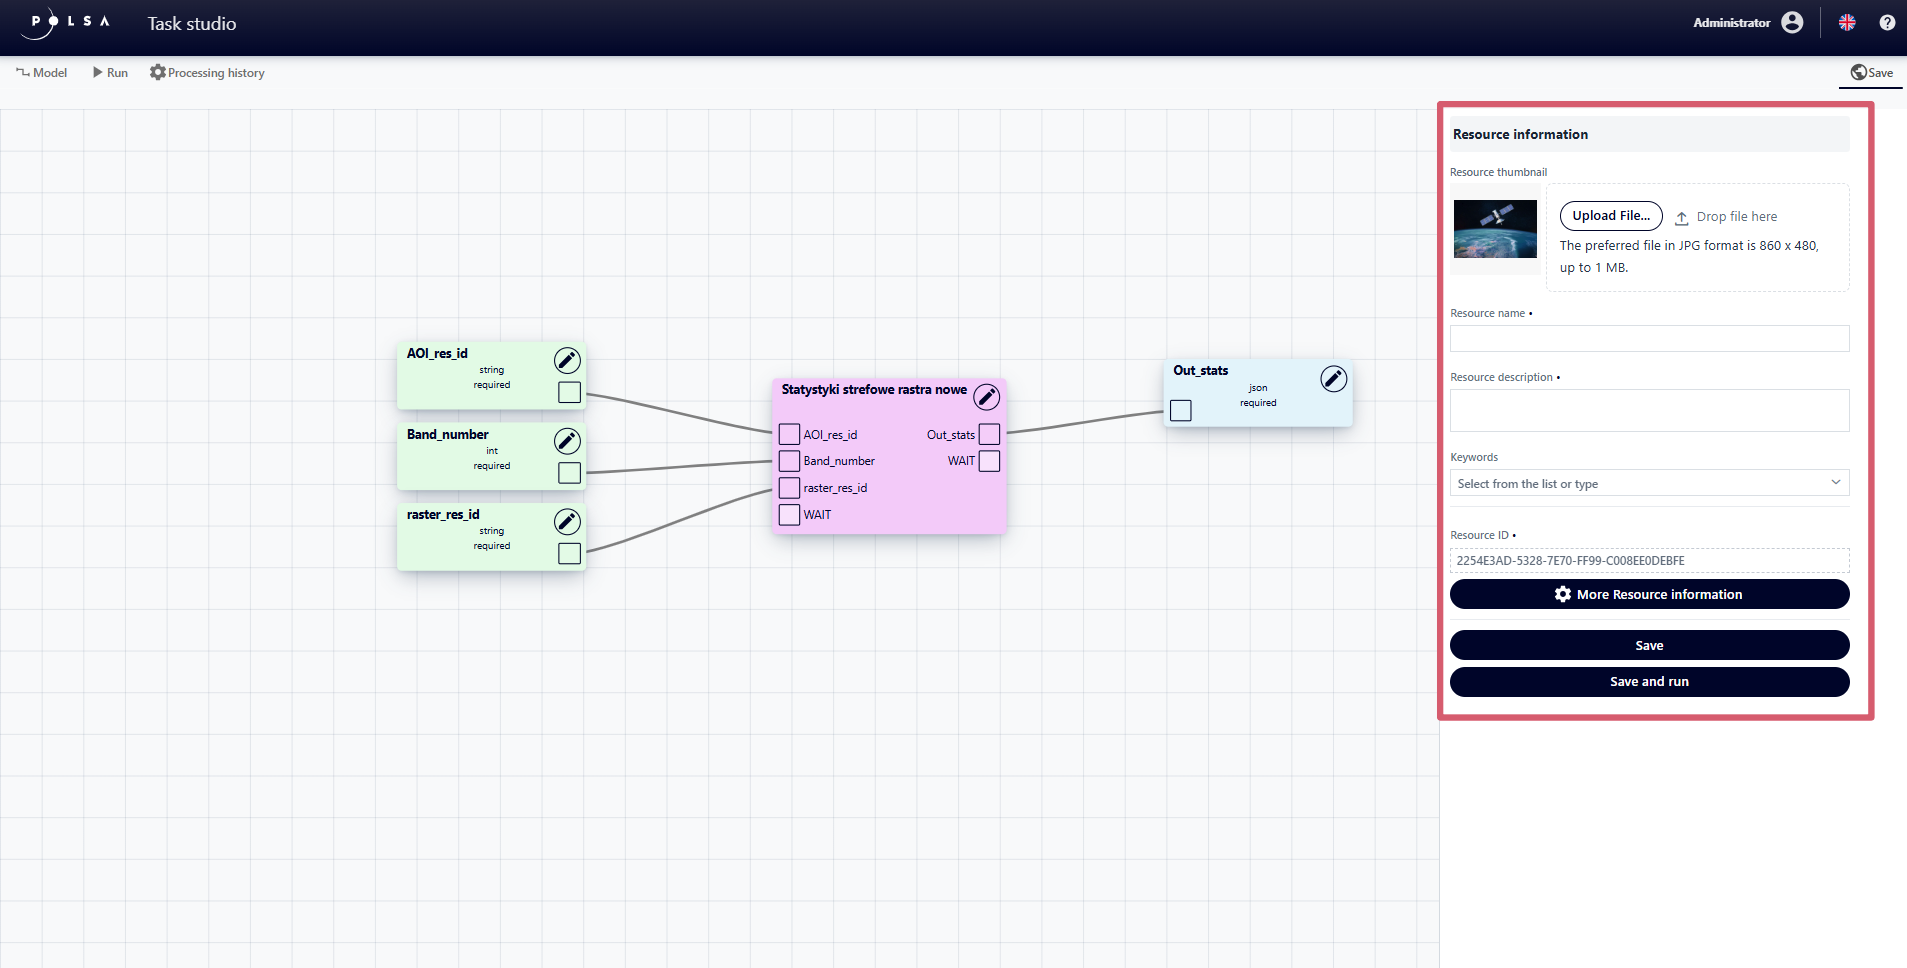
Fig. 23. “Resource information” Panel
By clicking the “More information about the resource” button, the application displays the data of the user who created the resource.
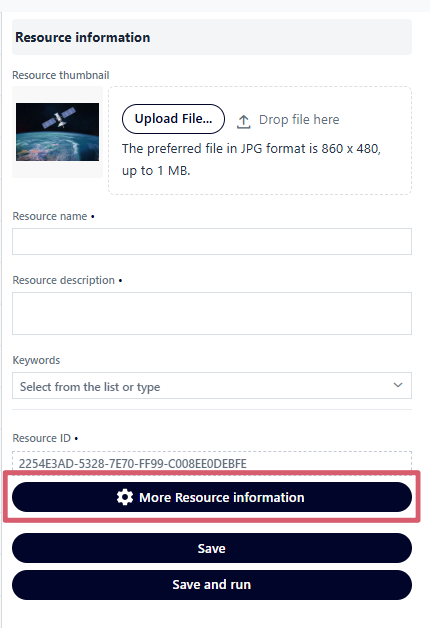
Fig. 24. “More information about the resource” button
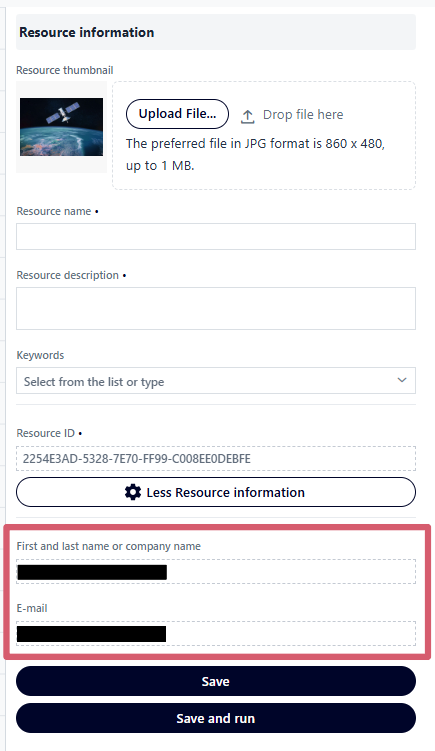
Fig. 25. More information about the resource
After filling in all the required fields, the user clicks the “Save” button in the “Resource Information” panel. The resource will be saved in NSIS Cloud, and a confirmation message will apear in the lower-left corner indicating that the save was successful.
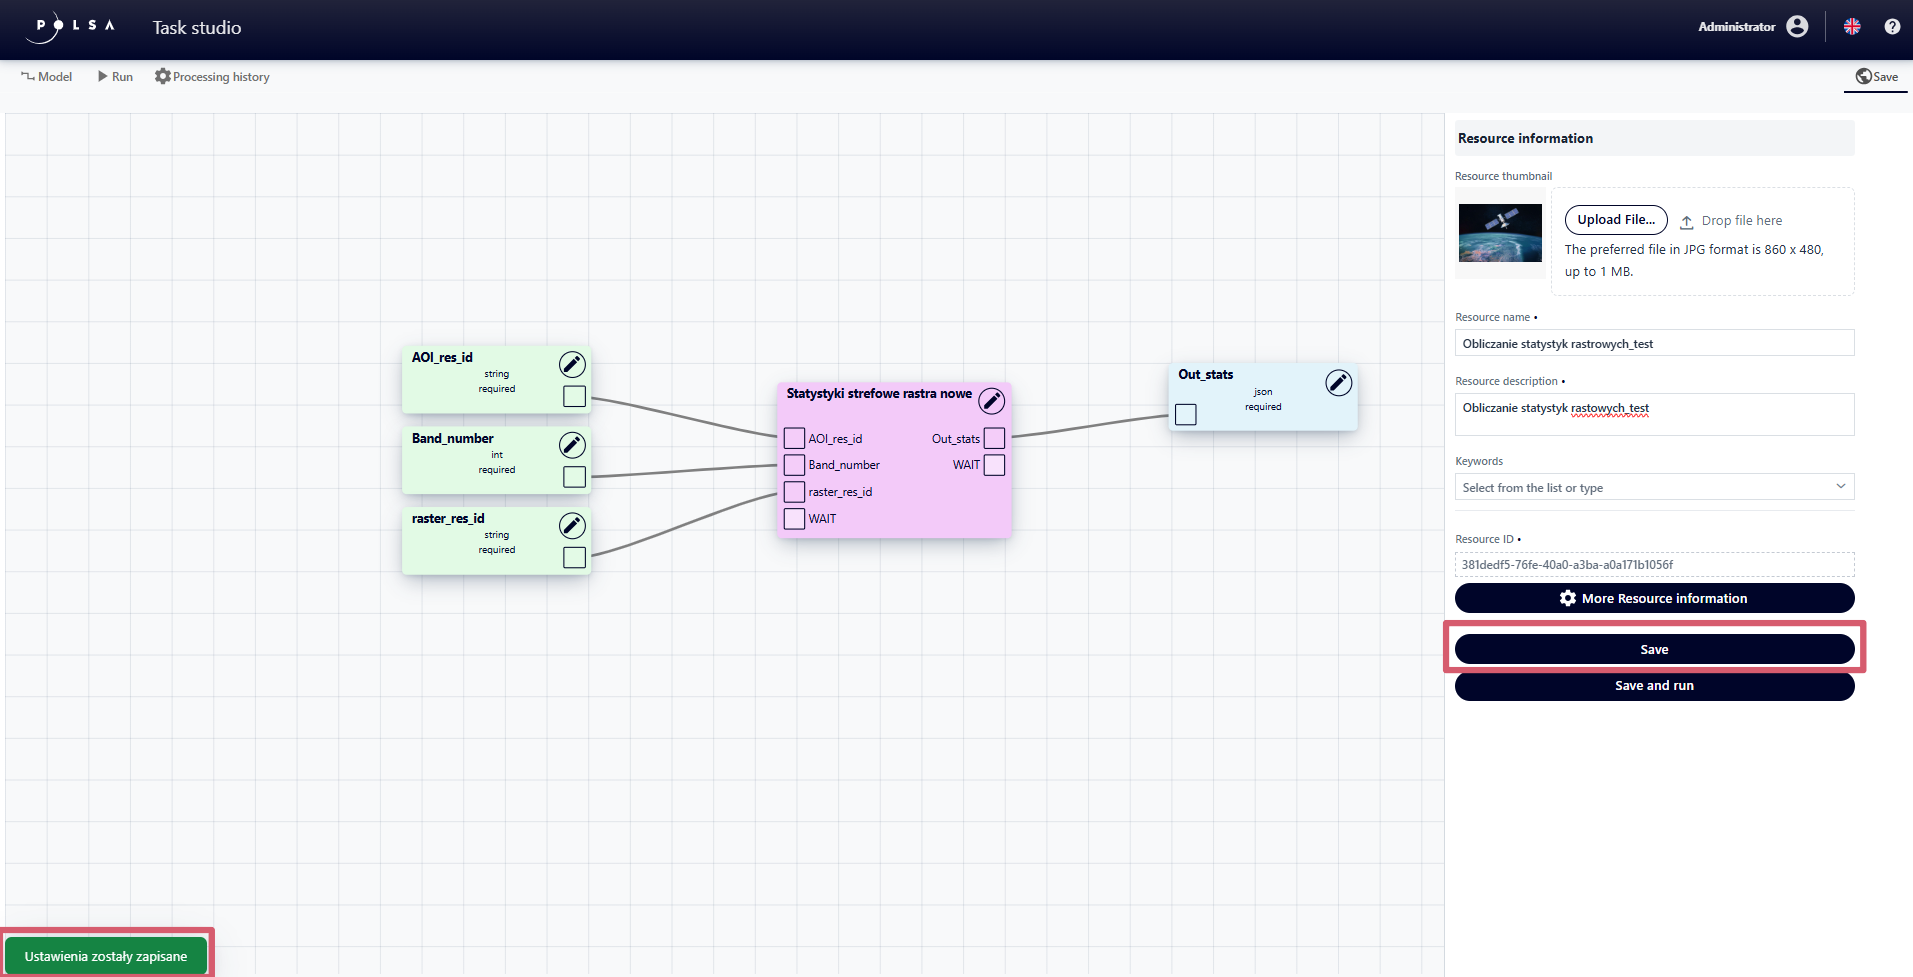
Fig. 26. Saving a resource
The “Save and Run” button allows the user to save the resource and immediately launch the analysis.
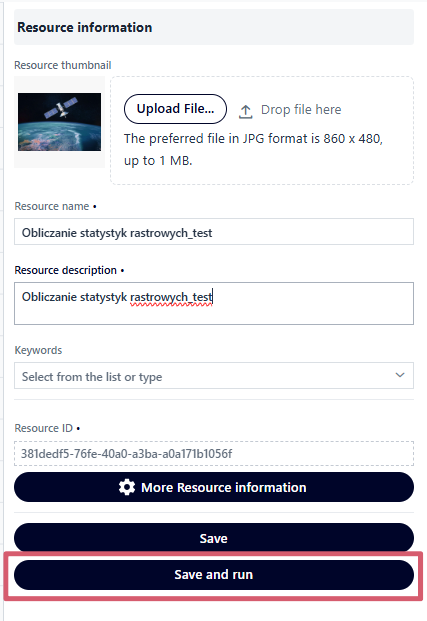
Fig. 27. Save and Run
5. Running the analysis
After saving the analysis, the user navigates to the “Run” tab. Alternatively, if the “Save and Run” button is used, the application automatically takes the user to the “Run” panel after saving the resource. The content of the “Run” panel varies depending on the configured model.
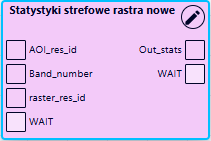
Example 2. Running the analysis: Calculating zonal statistics of a raster
The user clicks the “Select resource” button and in the “Select resource” window, chooses the raster from the list for which he wants to calculate statistics, then confirms by clicking the “Select” button.
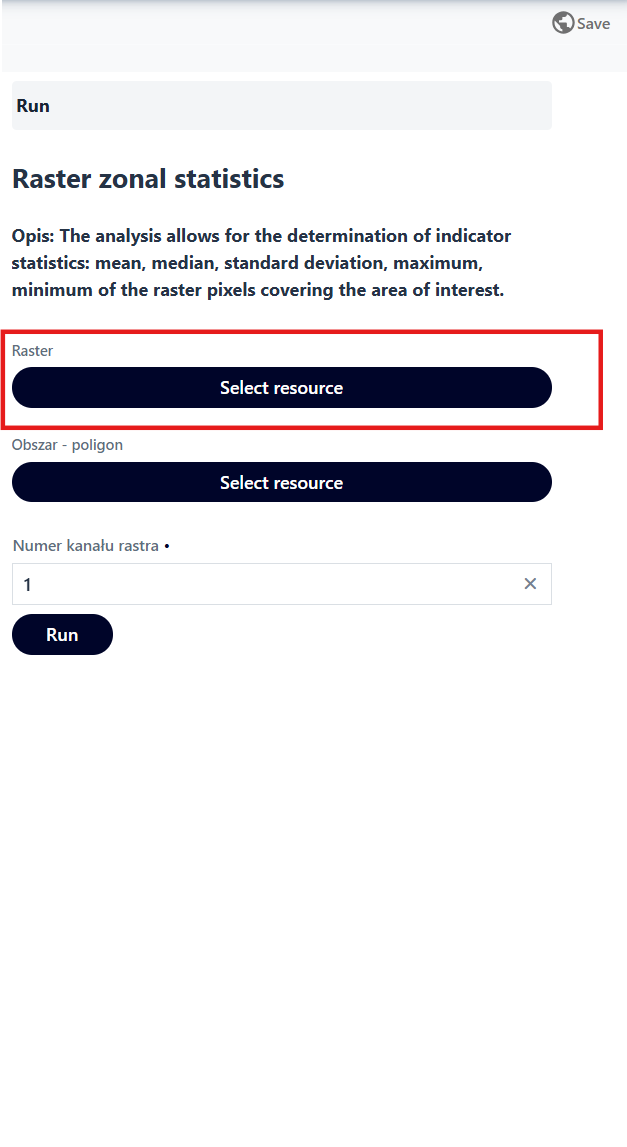
Fig. 28. “Run” panel, “Select resource” button
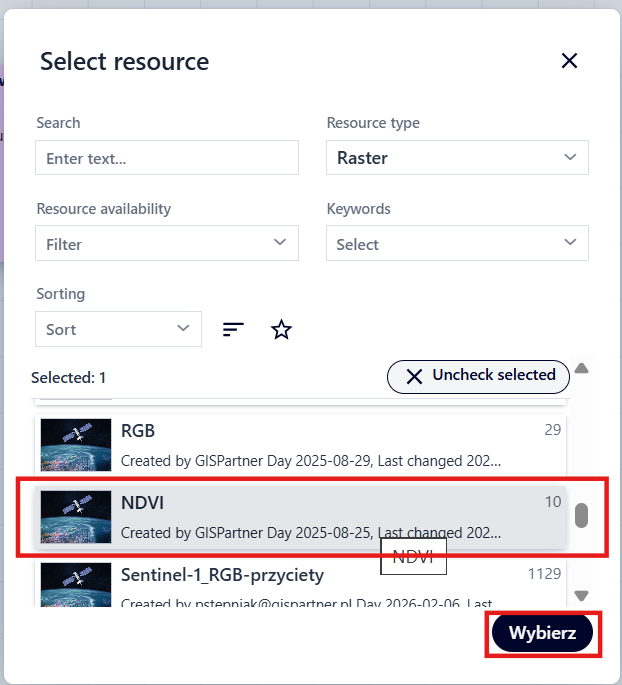
Fig. 29. “Select resource” window
Select a resource in the Area - Polygon field.
Enters the raster band number.
Clicks the “Run” button.
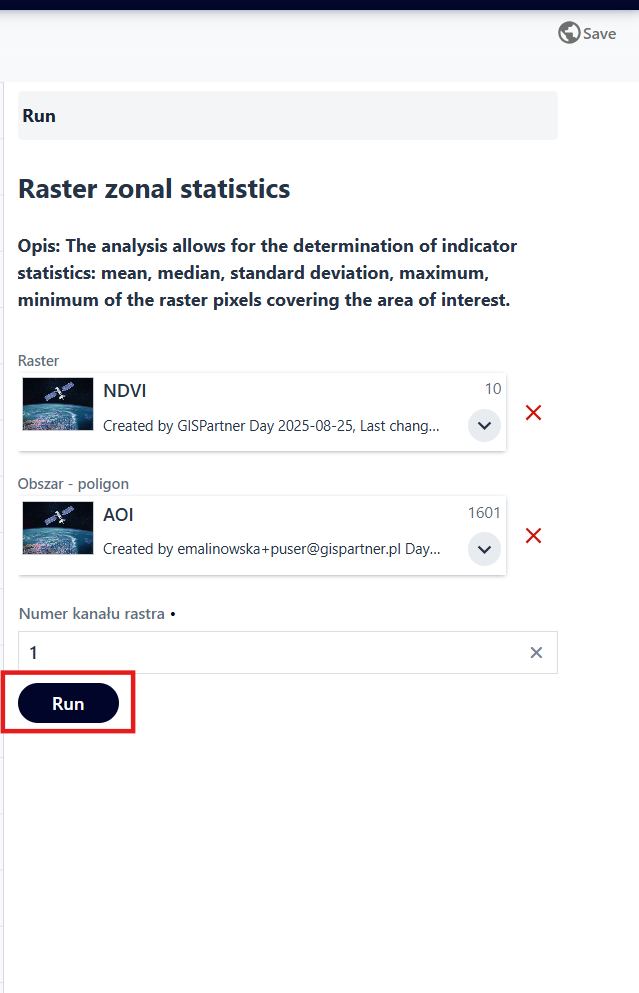
Fig. 30. “Run” button
The results of an analysis vary depending on the model and input data used. However, for each analysis, after execution, a summary is displayed containing:
Description - a summary of the task’s function,
Task ID - the unique identifier of the task,
Status - the current state of the stask (“active”, “successfully completed”, “failed”),
Progress - a numerical indicator of the task’s progress,
Input Parameters - a list of input data required to run the task,
Results - depending on the configured model, this may include a raster, file, table.
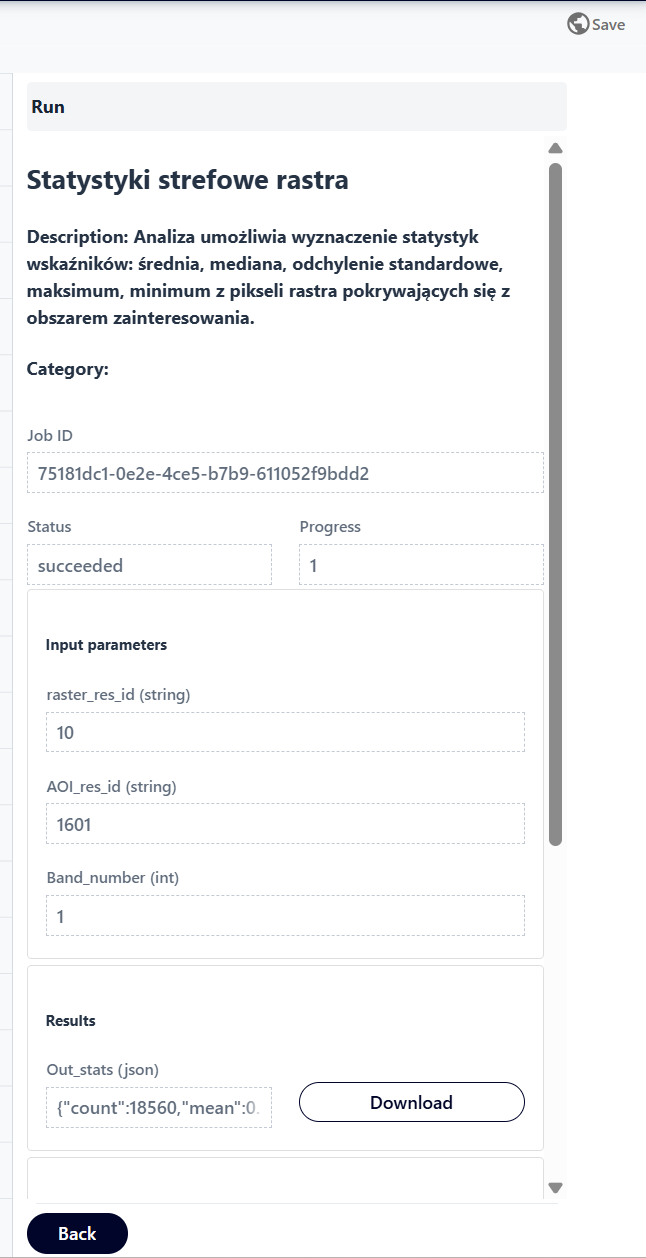
Fig. 31. Analysis result - example
The “Back” button allows the user to return to the “Run” panel, enabling them rerun the analysis with a new dataset.
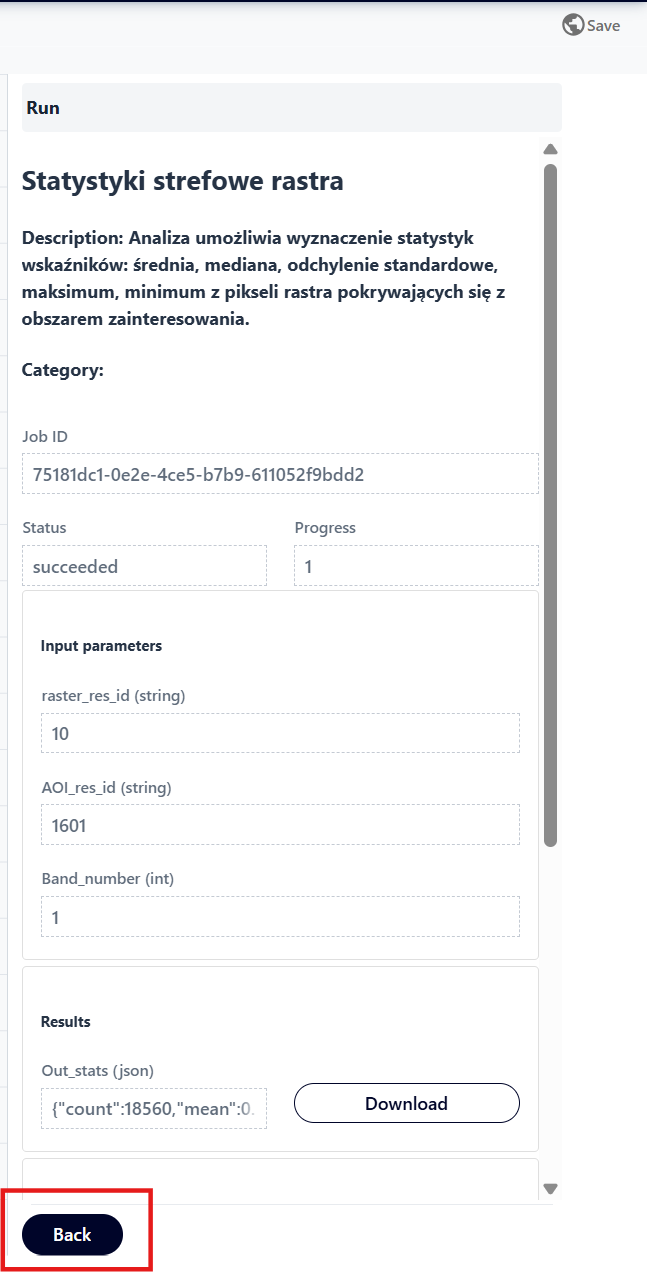
Fig. 32. “Back” button
6. Processing history
After the first execution of the analysis, an additional “Processing history” tab is displayed. The table it contains shows the processed tasks for the configured model.
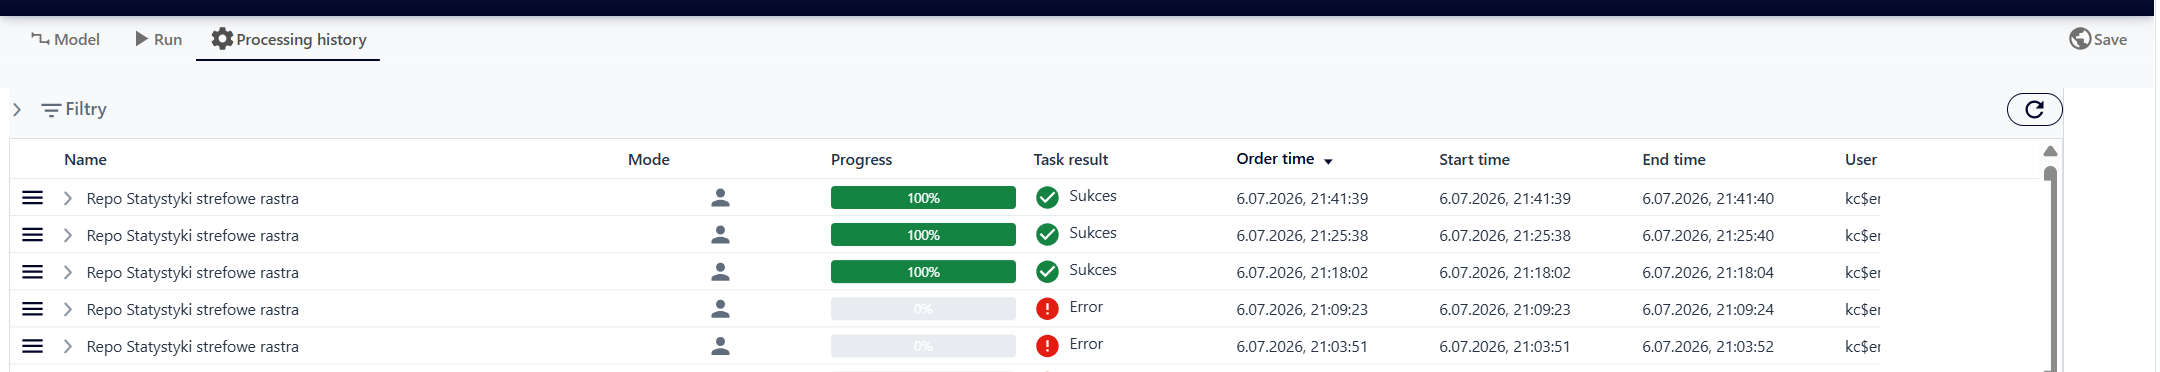
Fig. 33. “Processing history” tab
The application allows the user to filter and search analysis results. To filter the tasks listed in the table, the user clicks the “Filters” button.
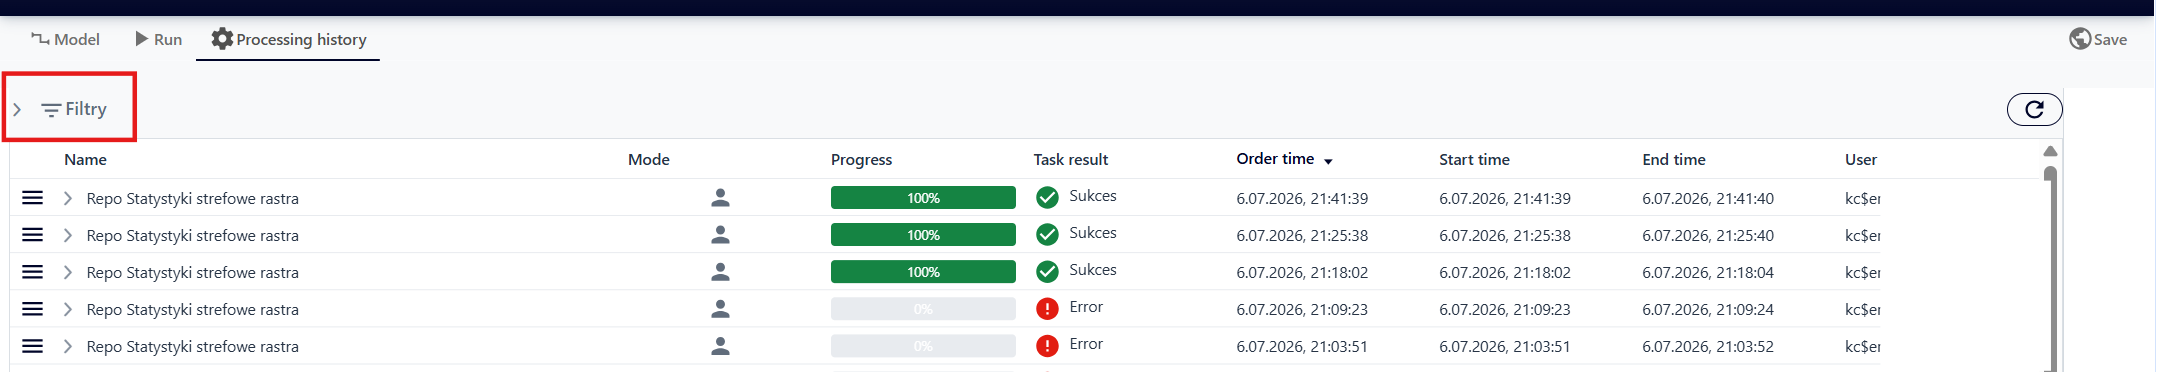
Fig. 34. “Filters” button
The user selects the filtering options:
Start Date From, Start Date To - allow narrowing the displayed tasks to a selected time range, as well as analyzing their durations.
Run Mode - displays analysis result that were run either “On Demand” by the users or “Scheduled”.
Task Result - filters the results table according to the selected status:
Success - the task completed successfully, without errors;
Error - an error occurred during execution, the process was completed;
Running - the task is curently in progress;
Submitted - the task has been submitted and is waiting to start processing;
Cancelled - the task was stopped by the user before completion;
Cancelling - the task is in the process of being canceled;
Pending - the task is waiting in the queue.
Process Type
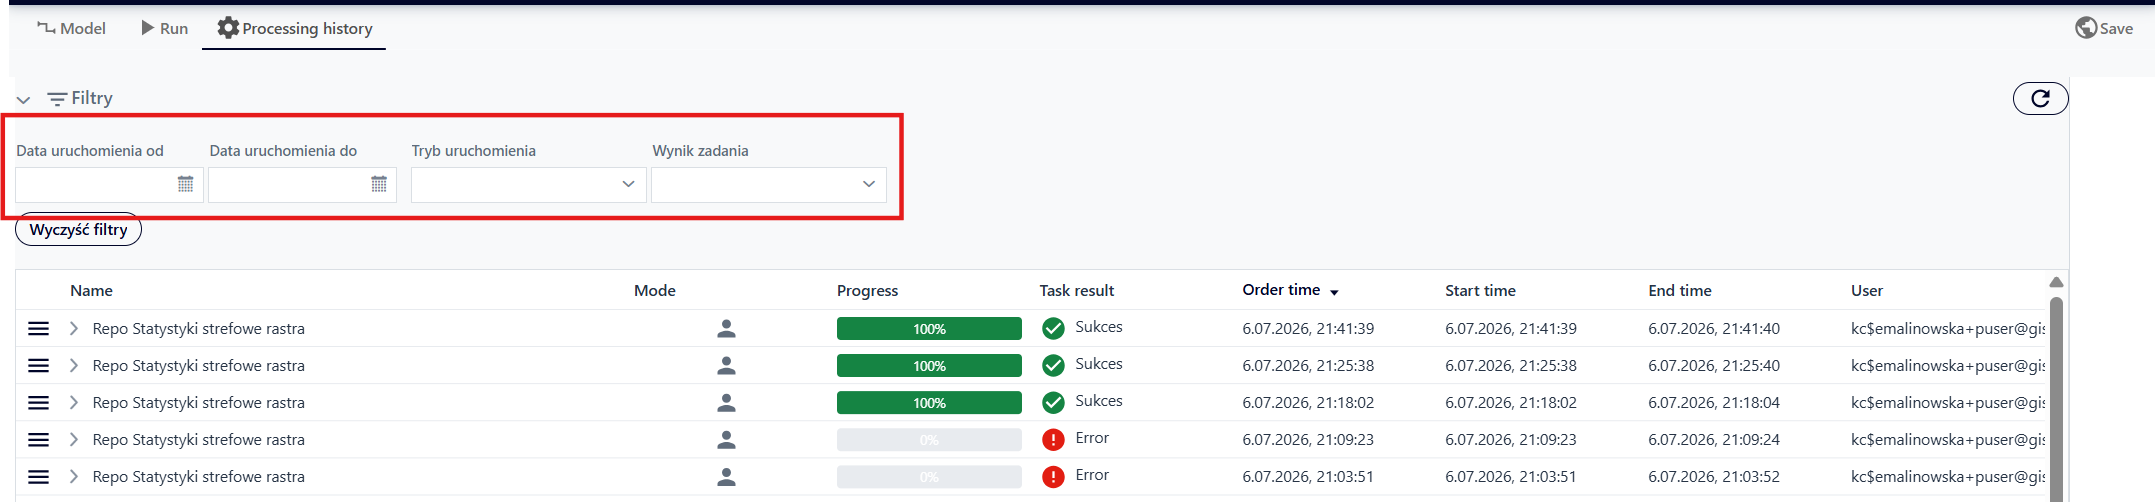
Fig. 35. Available processing history filters
After selecting filters or entering a phrase in the search field, the user clicks “Apply.” To clear the filtering or search parameters, the user selects the “Clear Filters” button.
To update the displayed data in the table, the user uses the “Refresh Content” button.
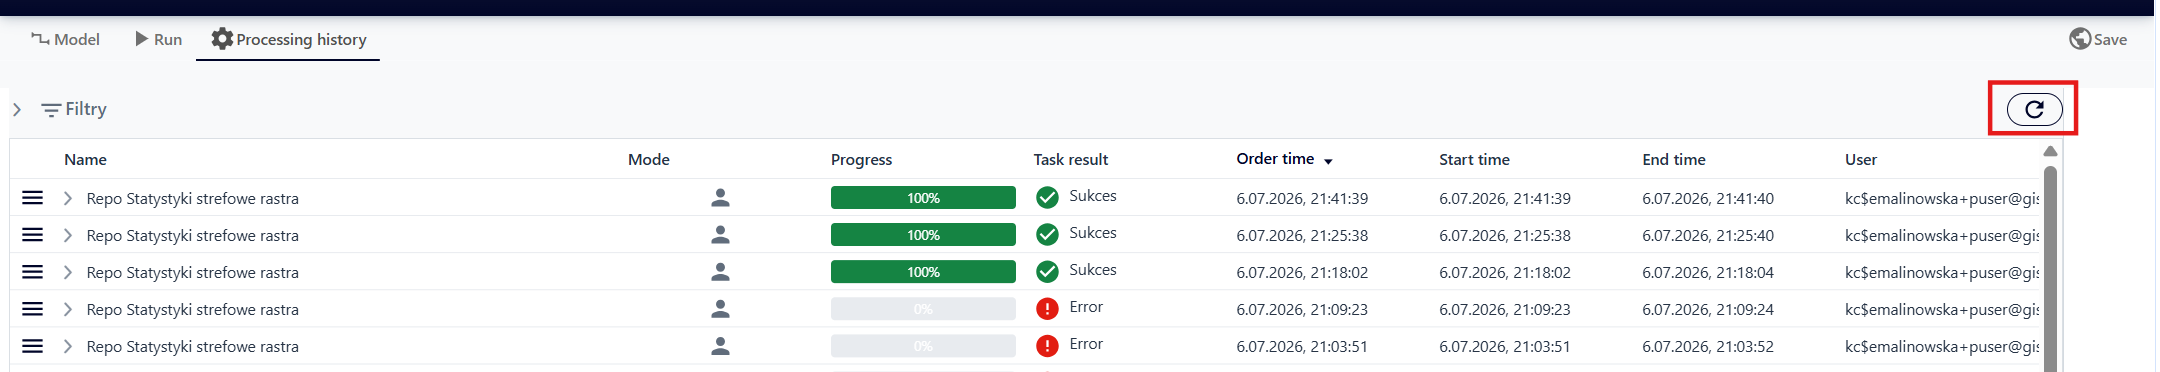
Fig. 36. “Refresh Content” Button